This is the 7th and final part of our blog post series on how we upgraded our Elasticsearch cluster without downtime and with minimal user impact. In this post, we will focus on several of the benefits we have seen after the upgrade and provide more details on how our architecture looks today.
Master nodes - efficient cluster state updates and less CPU usage
Whenever something is changed in Elasticsearch, like a new node is added or a new index is created, the master nodes synchronize the cluster state with all the other nodes in the cluster.
In the old cluster, the cluster state was synced by the master sending the full cluster state to all the other nodes. When a cluster has 1000+ nodes and 90,000 shards, the cluster state can be 100s of MB large and then the network bandwidth of the master node becomes a bottleneck, slowing down every cluster operation.

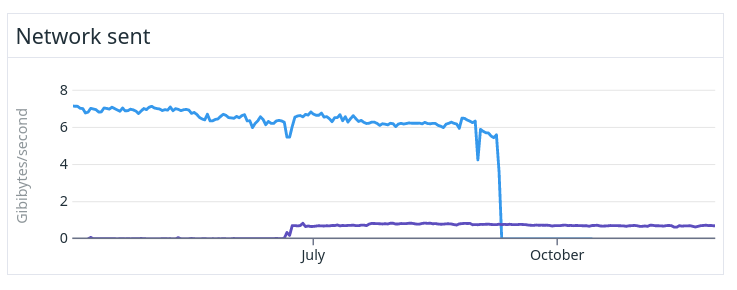
The figure above shows the differences in network bandwidth used by the master in the old and the new clusters. The big difference is because in recent versions of Elasticsearch, only send deltas of the cluster state to the other nodes, which greatly reduces the bandwidth required by the master node. The purple line shows the new version which has a 90% reduction in network usage.
Another master node bottleneck was that in the old version many cluster operations were made by a single JVM thread on the master. And the computing time sometimes grew linearly (or worse) with the number of shards there were. To be able to process certain cluster operations quickly we had to use instance types with the fastest single core CPU speed possible. In addition, the network bandwidth had to be as high as possible, which forced us to use some of the most expensive instance types we could find on AWS to run the masters on in the old cluster.
But due to this new way of handling cluster updates, and several other improvements made in recent versions of Elasticsearch, we were able to use much smaller instance types with less CPU and network resources, reducing the cost of the master nodes by 80%.
Data nodes and their JVM
In the old cluster, we used Java 8 to run Elasticsearch which was the latest Java version supported at the time. In the new cluster, we use the bundled Java 18 version which allows us to utilize a more modern garbage collector that works better with larger heaps. We used CMS in the old cluster and use G1 in the new one. That change alone greatly reduced the duration and frequency of “stop the world” GC pause times when executing searches. Garbage collection on the data nodes is nowadays working so well that we don’t have to think about it anymore.
With the addition of the G1 collector we were also able to experiment with larger heaps. Elasticsearch doesn’t recommend going above 32GB in heap in either version because of compressed object pointers but our extensive testing showed us that using a 64GB heap improved search times for our use-case so we settled on that. Using a 64GB heap still left us with an additional 128GB RAM for disk caches because the instance type we use for our data nodes (i3en.6xlarge) has 192GB RAM in total.
Two other notable, non default, settings that we use on the data nodes is that we have 48 search threads per node (instead of 37 which is the default for 24 core machines) and utilize transport compression for node to node communication. All of the changes above have been carefully benchmarked on real traffic before we settled on the values above.
Heap utilization
A large number of improvements to heap and memory consumption were made to both Lucene and Elasticsearch while we were still running our custom fork. We were able to backport some of the enhancements, but not all of them. One change in particular, moving storage of the terms indices from the java heap into the disk (released in Elasticsearch 7.7) made a huge difference for our use case.

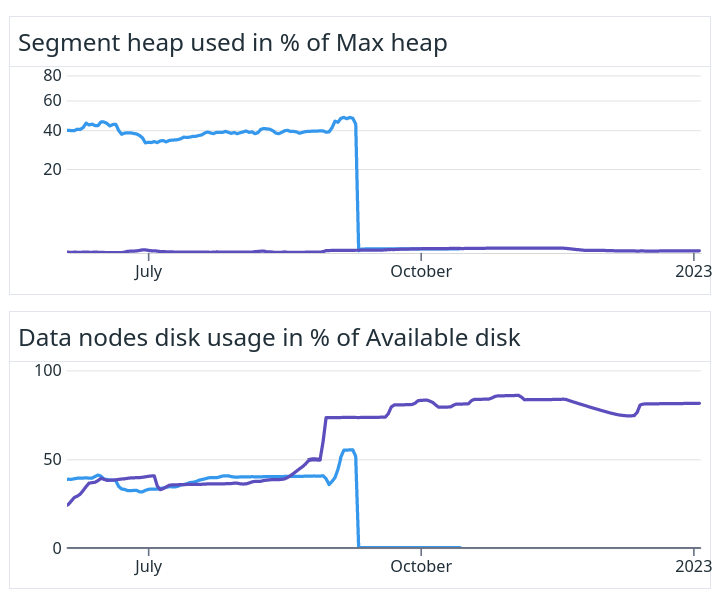
These figures show that we went from 40-50% of the heap being occupied by static segment data (that grew with the amount of disk we used) down to <1% for the new cluster. This meant that we could change the data nodes disk utilization from the previous 45% to a healthy 83% instead. Purple lines show the new version.
Because we skipped several intermediate Elasticsearch versions in the upgrade it is hard to tell exactly which other changes contributed. What we can say is that all of the Elasticsearch improvements combined with our wildcard prefix solution explained before made it possible for us to scale on disk instead of heap, which behaves in a much more predictable and stable way. This also means that we now don’t have to pay extra for underutilized CPU and RAM.
All of this allowed us to reduce the cluster from 1100 data nodes down to 600 equivalent ones, while still performing as well, or better in terms of latency and throughput.
Rolling cluster restarts
Doing a rolling restart of all the data nodes in the old cluster was a real pain. A complete restart could take up to two months to complete which forced us to either batch many changes at once, which increased risk, or don’t do any changes at all, which limited our ability to deliver a good service to our customers.
In theory, restarting a cluster should be as simple as described in the Elasticsearch documentation, but for the following reasons it did not work well for us;
We couldn’t stop the indexing for very long because of the constantly high rate of incoming documents and updates and the uptime demand we have on our application.
Due to the sheer size of our cluster state, >200MB, and the fact that older Elasticsearch versions do not handle node join/leave events very efficiently. It could take several minutes for the cluster to simply detect and fully process the fact that a single node had left the cluster. The time got longer the more nodes that left.
- So with >1000 nodes and ~5min/node restart cycle, even a perfect restart (where all data on all nodes could be immediately used after it had started up again) would take over 80 hours just to process all the leave and join cluster events.
In older versions of Elasticsearch, it is very common that existing data on a restarted node could not be fully re-used. It had to be recovered from other nodes as part of the startup and restore process, and at PB scale that can take a very long time, several hours, even when running on instance types with lots of IO and network bandwidth.
- That meant that we were not even close to achieving these perfect conditions mentioned above. So instead of a ‘perfect’ 80 hours restart ours took weeks or even months to complete.
A final complication was that sending data from one node to another uses extra disk space on the node that sends the data. So to not risk running low on disk we were forced to only restart a few nodes at a time. And after every restart batch we had to wait for hours to get back to a green cluster state and move on to the next batch.
However, recent versions of Elasticsearch use something called global/local checkpoints to speed up restarts. When a shard goes offline, e.g. during a rolling restart, the primary shard will keep track of the deltas from when the shard went offline to when it comes back online again. Then, to recover the shard Elasticsearch can just send these deltas instead of the entire shard. This, together with improvements to the master node handling leaving/joining nodes, speeds up the restarts greatly and a complete rolling restart just takes one day now, instead of months.
Index snapshots
Another major issue in the old cluster was snapshotting of the index data. The main issue was that we couldn’t delete old snapshots fast enough, so our backups just grew and grew in size.
The reason for this was due to Elasticsearch iterating all the files in the snapshot bucket before it could remove a snapshot. This iteration takes a long time when you reach petabyte sized backups. Newer versions of Elasticsearch have improved the snapshotting code which greatly reduces the time for deleting snapshots.
Our solution for preventing this continuous snapshot data growth was to change the S3 bucket every 4th month. At that time we started over from scratch with a full backup into another S3 bucket, while still keeping the old one for safety. Then, when the second full backup was completed, we could remove the data from the first S3 bucket and finally save some money.
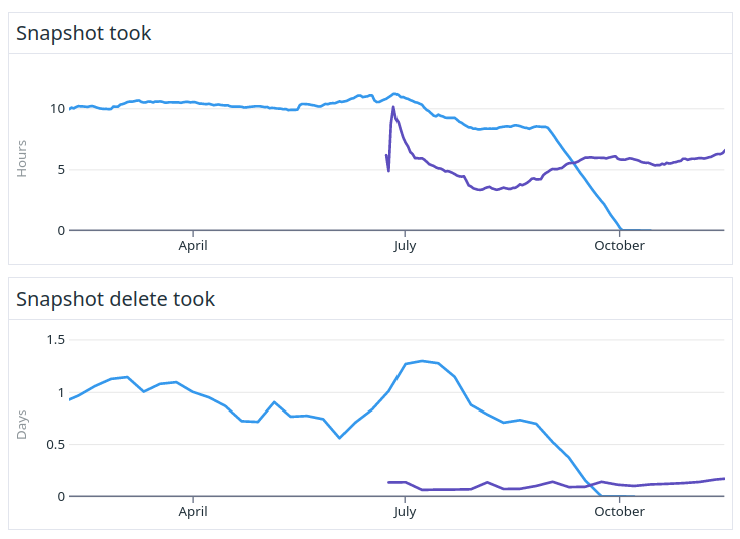
With the old alternating bucket snapshot strategy we used on average 8PB to store the snapshots. In the new cluster, we only need 2PB because Elasticsearch can now easily delete old snapshots quicker than new ones are created, reducing our backup costs by 75%. Creating snapshots is also 50% faster than before while deleting snapshots is more than 80% faster.

The above figures show the time for taking and deleting snapshots from the old and the new cluster. Purple lines show the new version.
Adaptive replica selection
In the new cluster we use a feature called Adaptive replica selection (ARS). This feature changes the routing of search shard requests so that the requests are sent to the least busy data nodes that have the given shard, thus reducing search times. In our old cluster we had implemented a similar feature where we tried to send search requests to the least busy availability zone. If you are curious about that solution we have described it more in an older blog post.

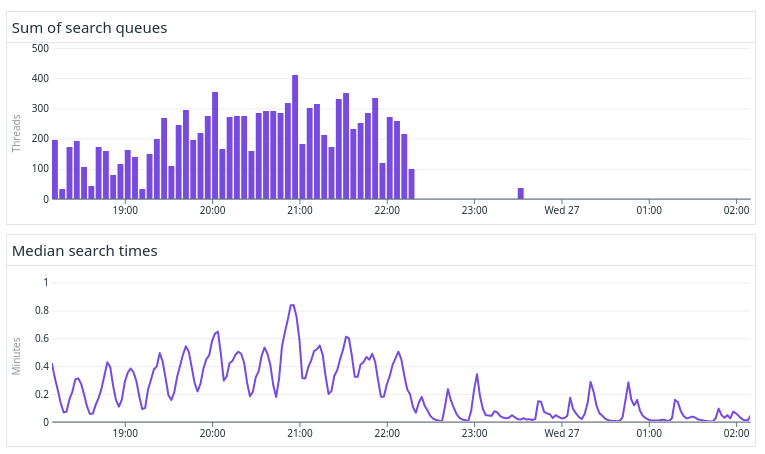
The above figure shows a benchmark where we first ran without and then with ARS enabled. After ARS was turned on we saw a large reduction in the amount of search queues, which in turn significantly improved the search latency.
Index sharding strategy
Our cluster uses 3 availability zones (AZs) in AWS. For all data we keep 2 replicas for every single shard regardless of the age of the data. We use shard allocation awareness which makes sure that we end up with one replica per AV zone for failover and redundancy reasons.
We use time based indexing and we both have daily and monthly indices. For some old and small indices we even have a few yearly ones. Worth mentioning is also that we shard on the original documents’ publish time, not on the time we received the document.
New indices are created a few days before they start to receive data. We do not allow any auto creation of indices based on index requests. The whole index creation, setup and configuration orchestration are done by a set of custom tools to allow for the fine grained level of monitoring and observability that we require and allows for an elasticsearch-infrastructure-as-code workflow.
Optimal placement of these new, as well as all the existing indices, is handled by our custom built shard balancing tool that makes sure to place indices on data nodes in a way that balances age, size, search and indexing load evenly. This eliminates hotspots and achieves an even spread of load on all the data nodes across the entire cluster. Our system is fairly similar to how Elasticsearch 8.6+ is doing it but yet again with some extra knobs and features as well as more fine grained monitoring and observability.


The figures above show the difference in CPU distribution between a non-optimal system (above) and an optimally balanced system optimized by our tool (below). As can be seen, the CPU usage is much more equal across all the data nodes in the balanced system and there are no apparent hotspots that slow down search and indexing unnecessarily.
Running a balanced system not only makes our system faster and more predictable, it is also cheaper as we can run with smaller margins and higher overall resource utilization.
Index merging
Updates in Elasticsearch are implemented by tombstoning old versions of documents and replacing them with a new version in another segment. The tombstones are later garbage collected by automatic merging of index segments.
As previously mentioned we receive a lot of updates to our documents which in turn means that there are a lot of tombstones being written into our shards and segments. That is not a major concern for us however as we have very performant hardware with fast disks and CPU to spare, so we can easily keep up with segment merging and it is never a bottleneck for us. In order to keep the extra disk usage caused by tombstones to a minimum we have configured a very aggressive merge policy. Especially the index.merge.policy.deletes_pct_allowed setting which controls how many tombstones that are allowed before an automatic merge is triggered have been set to its lowest possible value.
The minimum value allowed is 20%, but if we had been allowed we would have wanted to set it to perhaps 5 % instead, to force merge more often than today, but currently Elasticsearch does not allow that. This means that we are using up to 20% extra disk in the cluster to store tombstones that never get garbage collected which for us means several 100s of TB wasted disk in total.
In order to reduce this extra disk usage to a bare minimum we developed yet another of our custom tools called the merge-counselor. That tool manages the whole lifecycle and heuristics around index merging. The tool makes sure to schedule force merges for indices that need it, in a controlled and prioritized order, based on custom rules and heuristics. One of the rules is that indices older than 30 days are only allowed to have 5% deletes before they get force merged. Hotter data have more liberal rules, and today’s and yesterdays index is managed entirely by the Elasticsearch default settings in order to prioritize indexing speed for that data.

This figure shows the amount of disk occupied by deleted (tombstoned) documents in the entire cluster. In November we deployed our merge-counselor component and we have since then force-merged shards, removed tombstones and reduced extra disk usage by 400 TB. This has allowed us to scale down the number of data nodes by 9% and lowered our AWS costs accordingly.
Non technical benefits
Last but not least we also would like to highlight some of the non technical benefits we got after the upgrade. We now feel that we are in a better position to engage with the rest of the Elasticsearch community again. The feedback we can give on challenges that we have, or improvements we would like to see, are now more relevant to the Elasticsearch developers and hopefully more relevant for a broader set of users. All of this is because we now run an officially maintained and non-modified version of Elasticsearch.
As developers, it is also a great feeling that we are yet again keeping up with the latest and greatest in search technology and can benefit from all the exciting innovations that are still happening in the industry. Our life “after the upgrade” has only just begun and we know that there’s a lot more potential to unlock in the coming years.
Our desire to contribute more back to the community has also just begun, even though we already have made an effort to create this very blog post series, improved how shard request cache keys were computed and held an Elastic meetup talk.
We hope that we will be able to keep this up and make more contributions going forward as well as give feedback to the community on how well some Elasticsearch features work at PB scale with our particular use case and requirements in mind.
Some topics that might come up in future blog posts (no promises) would for instance be to give more details on how our workload performs on ARM powered instances, how we manage to continuously measure the exact load each and every query creates in the cluster or the outcome of our experiments with data tiering.
In conclusion
So in short, these were the most important improvements that we got from the upgrade
Improved system stability and resiliency through better handling of the cluster state
Reduced total cluster cost by more than 60%
Quicker and easier scale up (or down) based on changing business needs
Quicker and easier rollout of new changes
Fewer custom modifications to Elasticsearch to maintain
- All the modifications are either packaged as plug-ins or external tools/applications, we no longer need a fork of Elasticsearch
We can accelerate innovation again with all of the legacy code gone
The next upgrade will be a lot smoother than this one
We can get closer to the rest of the Elasticsearch community again
And with that, this blog post series is done! Before we end we would like to thank all the great teams in Meltwater and our fantastic support organization that supported us throughout the upgrade. The upgrade wouldn’t have been possible without you!! ♥️ We also want to send a big thanks to all of you who read and commented on this blog post series, we hope you enjoyed it!
To keep up-to-date, please follow us on Twitter or Instagram.
Previous blog posts in this series:
