Welcome to this sixth part of our adventure of upgrading our Elasticsearch cluster. Until now, we have explained how we structured our work, improved our system to make this migration possible, how we took advantage of this opportunity to make otherwise hard changes, and made sure to keep the system performing well under load. All of these changes were the result of hard work and planning, but in the end, we all knew that one day we will be faced with the ultimate question: When can we turn the switch, and start using our new and shiny cluster? We don’t think that anybody would want to be in the place of the single person who would snap their fingers and make the decision to switch. We didn’t want it either, so we decided to let the data guide us.
Will it actually work?
As we mentioned in our first post in this series, we had to be able to design a gradual, reversible, no-downtime solution for rolling out our new cluster. This meant that we had to have a non-disruptive way of testing our production workloads in a real-life environment, and only start enabling the new cluster once we were sure it would perform according to our expectations. The key to achieving this was to start collecting data as early in the process as possible. Instead of waiting for the new cluster to be filled with petabytes of data, we wanted to start executing requests as soon as possible, regardless of the amount of data it contained. With the data we collect, we aimed at answering the following questions:
- Are there any search requests that succeed in the old cluster but fail in the new one?
- Do the searches executed in the new cluster perform as well as the ones from the old cluster?
- Do the same searches produce the same/similar1 results when executed towards different clusters?
Our team has a deep-rooted culture of experimentation and making data-driven decisions. We make heavy use of Datadog and Kibana coupled with a collection of general-purpose and custom-made testing and load generation tools to understand how our systems perform under stress. This meant that we already had a significant portion of the required tooling in place for us. One of the most useful tools in our toolbox was called request-replay. It is a tool that captures and stores all the searches executed by our production search service, and replays them by re-sending the stored requests to our search infrastructure. It was originally designed to replay actual traffic from our production environment to our development/staging environments, but later it was extended to also replay the traffic towards a canary deployment in the production environment.
As a tool that was specifically designed for our workloads, request-replay has some useful features:
- It can replay the requests following the same distribution over time, so we imitate the burstiness of the original traffic.
- It can mutate certain features of the original query (like the date range) to make it better fit the existing data in the target cluster.
- Instead of replaying the whole traffic, it can select a subset of the requests based on biased or unbiased sampling.
- It can compare the results, timings, and error rates between services, and send metrics about them to Datadog and Kibana.
As soon as we got ourselves a small cluster that started filling with data, we started replaying requests from our production environment. Thanks to this initial testing, we were able to notice and fix a set of more or less obvious issues at the beginning of our process. However, as our cluster grew, and we started planning for the release, we noticed that there was a key bit of functionality missing in request-replay: An ability to replay requests in real-time so that the same traffic can be sent to either old or the new cluster. While request-replay could execute stored requests, we also wanted to be able to have the ability to do performance comparisons under the same load. It would have been possible to implement this using a store/replay architecture, however, we decided that we would be able to analyze the results more accurately if both clusters executed the same load at the same time.
The rollout strategy
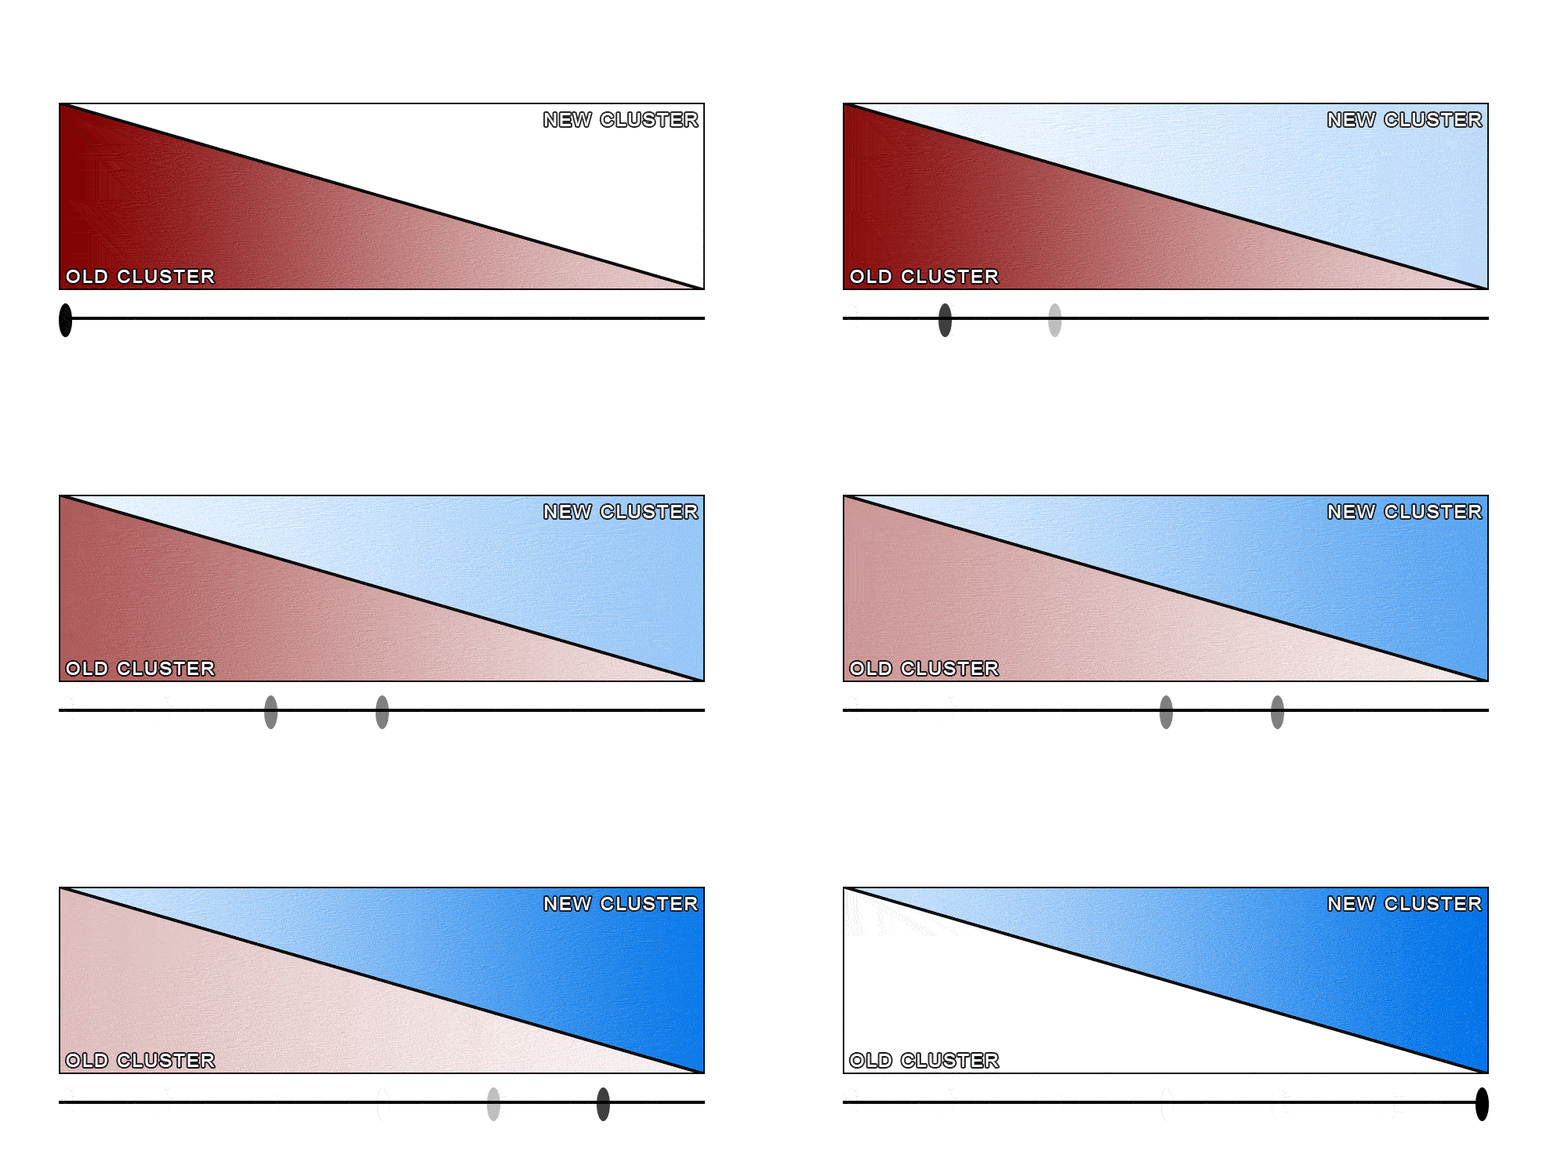
At this point we had an idea of our rollout strategy: We were going to replay all the requests to both clusters. Any traffic that was sent to one cluster would be replayed into the other one, leading to a complete feedback loop. We would start by sending 100% of the requests to the old cluster, and replaying all of them to the new one. Then, as we gather feedback, we would slowly increase the percentage of the requests sent to the new cluster, while replaying those to the old one. Eventually, all the requests would be sent to the new cluster, while being replayed to the old one. At that point, we can safely stop the replays and terminate the old cluster.
Of course, as with many good ideas, this was easier said than done. Luckily, the way our search infrastructure was set up simplified the process. Our secret weapon was our custom-built smart load balancer called the search-router.
How does a search get executed?
The Meltwater product is developed by many teams. For the sake of brevity, we are going to focus on what happens once our search subsystem receives a search request. In the simplest sense, our architecture looks like this:
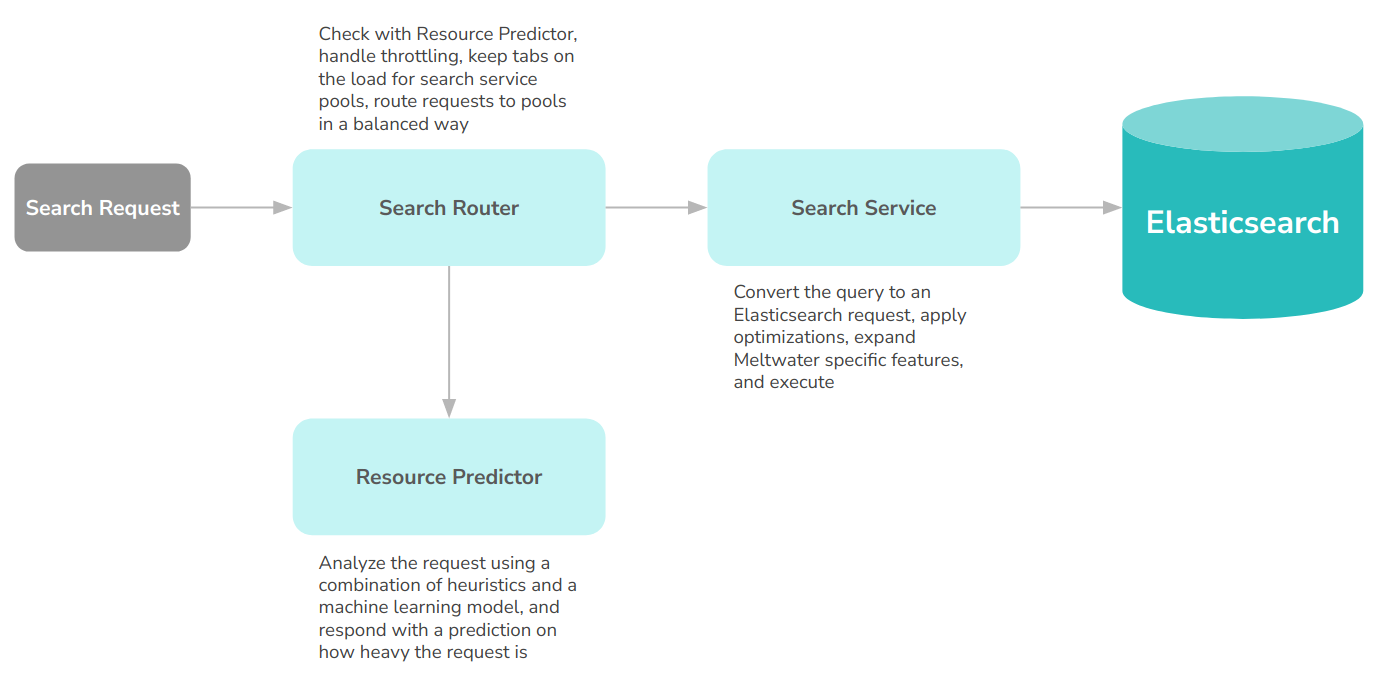
We initially used this architecture to be able to distribute the load evenly across our Elasticsearch nodes. However, we found out that having a smart load balancer could give us the ability to do more interesting things about how our traffic gets routed. As of today, the search router can also throttle requests on a per-user basis to prevent overloading the service when users execute heavy searches in parallel, reporting back metrics about requests both to Datadog and back to our users via HTTP Response headers. Then, during the migration, we also added new functionality: The ability to handle the replaying of requests across clusters.
Bringing it all together
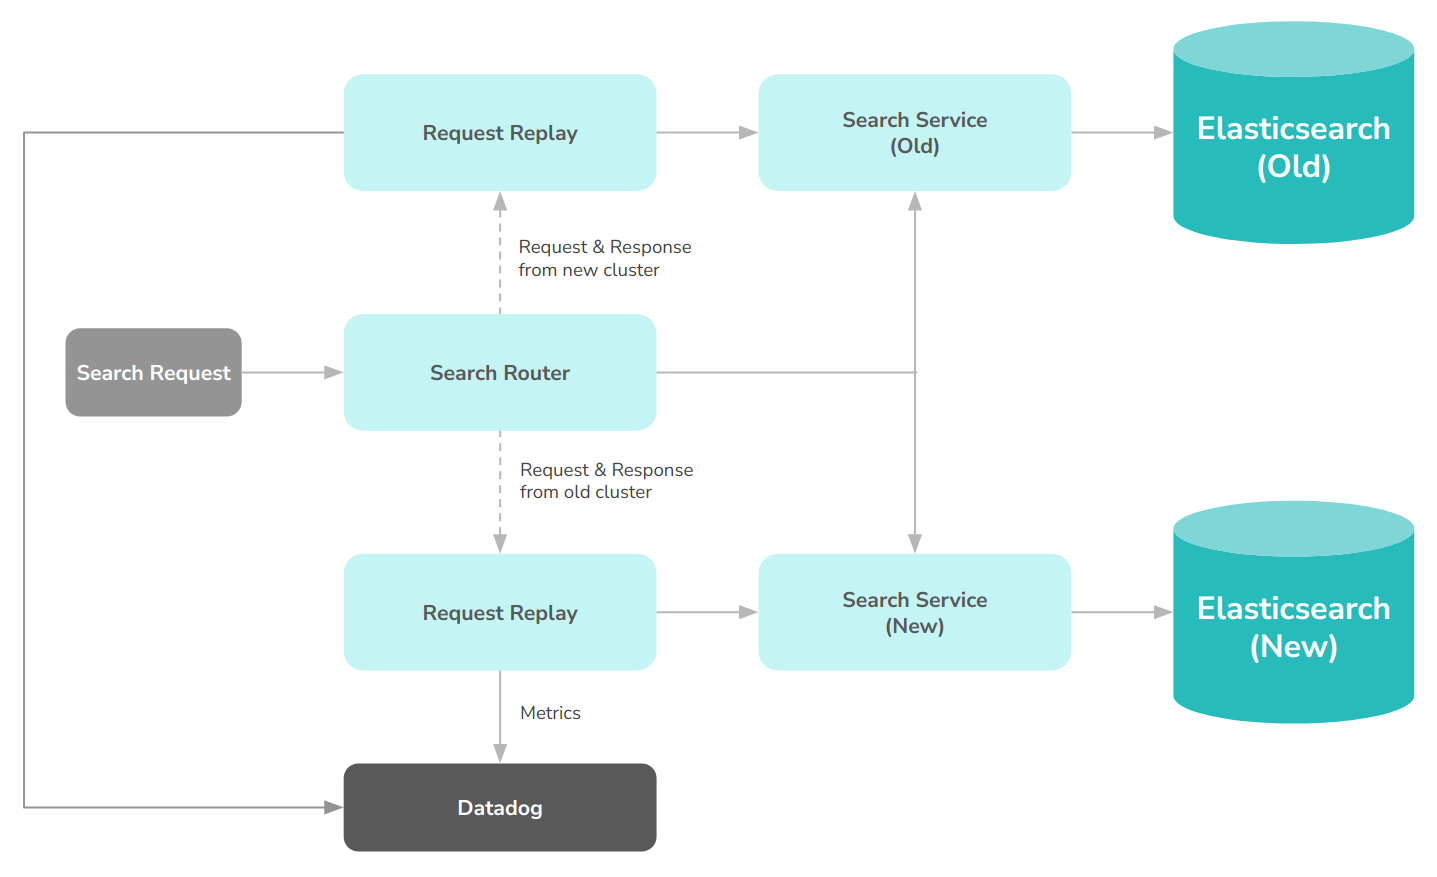
With our architecture explained above, we had a very clear design in front of us to implement. The search router would be responsible for deciding which requests should be routed to which cluster, and request-replay would be extended to be able to receive and execute requests via HTTP, instead of reading stored requests. This meant that the search-router would be responsible for executing both the customer request and the replayed request. While we could run them in parallel, making actual customer requests wait for the replayed request for comparison did not seem like a viable option. Instead, we opted for executing the actual request by the customer before attempting to replay. While this would introduce a slight delay in the replay process, it would be close enough to the actual request, while avoiding any impact on the customer experience. So finally we decided on the following architecture.
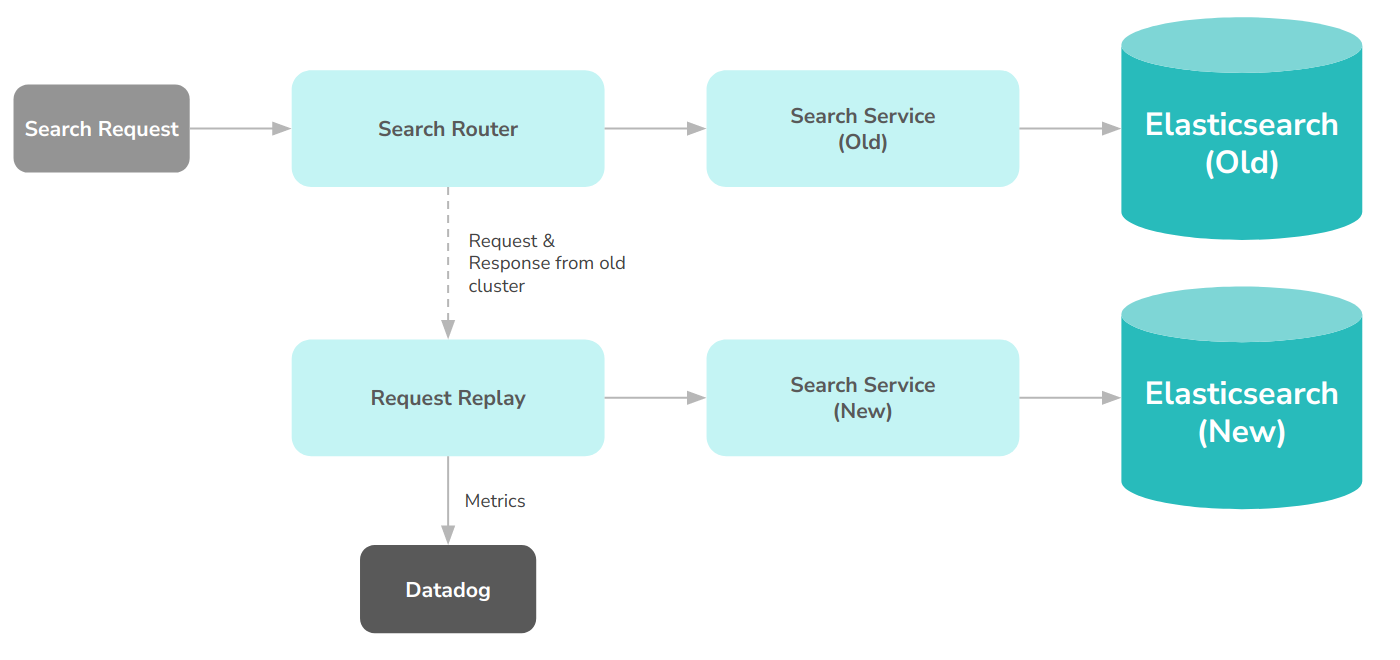
This meant that search-router would:
- Receive a request
- Decide on which cluster to execute the request in
- Execute it against the search service in the selected cluster
- Get the response
- Return the response to the customer
- Submit the request and the response to request-replay to be replayed against the other cluster.
Of course, since search-router could execute requests against both clusters, this meant that the architecture looked more like this.
How to choose who to route first?
The answer is simple: Nobody! We started our testing process by replaying the requests to the new cluster and comparing the results. As the results started streaming in, we all gave a sigh of relief, as we saw that we could now make the decision: We can simply route virtually all of our customers to the new cluster, and things will be fine. Virtually is the keyword here, as we also noticed a bunch of cases where the requests that succeeded in the old cluster failed in the new one. With this data at hand, we went on to design the following logic for deciding if a request should be routed to the new or the old cluster.
fun decide(
        request: Request,
        routingPercentage: Float,
        alwaysRouteToOld: Set<String>
): TargetCluster {

  val customerId = request.customerId
  if (alwaysRouteToOld.contains(customerId)) {
    return TargetCluster.OLD
  }

  val dateRange = request.dateRange
  if (!newCluster.hasDataFor(dateRange)) {
    return TargetCluster.OLD
  }

  val userIdHash = hashToFloat(request.userId)
  if (userIdHash >= routingPercentage) {
    return TargetCluster.OLD
  }

  return TargetCluster.NEW
}
We used the data we collected from the replays to build a list of customers which we deemed “risky to route to the new cluster”, but since the list was comparatively small, we didn’t want to wait for all the issues to be addressed before we started. Instead, we started by creating a new configuration value for the search router that contained all the customers that we wanted to make sure to route to the old cluster. Therefore we start by initially checking the request against that configuration, and if the customer was on that list, then all bets were off. We direct them to the old cluster. As we addressed the issues, we gradually emptied that list.
Of course, it would not make any sense to send requests to the new cluster if the cluster did not have the data to address the date range of the query. For that purpose, we depended on the concept of Day0: The day we started filling the cluster with our usual inflow of data.
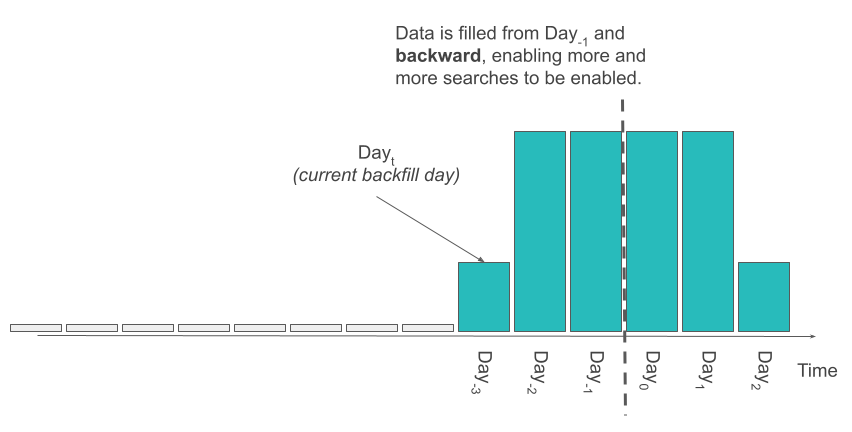
Any query that asked for data from Day0 and later, we knew that had the complete data. As we started the inflow for the latest data, we also started backfilling our data, starting from Day-1 and incrementally going back. As we backfilled the data, we kept updating the configuration of the search-router accordingly, extending the Dayt further back, letting it know the availability of more data. Once we have this configuration in place, when executing the query, the search-router analyzed the body of the query to determine the date range it covered, and made sure that it fell into the date range that we already have data, before routing the request to the new cluster.
Lastly, we only wanted to route a certain percentage of the users to the new cluster. We defined that percentage as a floating point number, between 0 and 1. Our initial implementation was to generate a random number at this point, and route the user to the new or the old cluster based on the number generated.
Very quickly we noticed the big issue with this approach: If the clusters returned noticeably different results, the users would see inconsistencies between the results they get as they refreshed the results, or even within the same page, as we have certain pages where we execute multiple queries towards the search system and display the results. If each of these requests gets redirected to a different cluster, it would be very frustrating for our users. Therefore, instead of generating a random number, we decided to generate a hash between 0 and 1 for each user based on their user id, and consistently route to a specific cluster based on this hash. This provided a more consistent experience for our users as we continued to tune the system behind the scenes.
Looking back
After all was said and done, the complete rollout process looked like the image below.

The best part about the whole process was how uneventful it was. From beginning to end it was smooth and tranquil. The visibility we had on the performance, stability, and compatibility of the system, coupled with the knowledge that we can roll back at any time allowed us to go as fast as possible, without breaking anything. To make this possible, we had to build new tools and modify our infrastructure to accommodate them, but we got instant ROI, not only in terms of process smoothness, but also in the well-being of our development team, and the safety of Meltwater’s business.
In the end, everything changed under the hood, and yet, everything stayed the same.
Stay tuned for our final installment in this series coming in 2023, where we will have an overview of our current architecture, evaluate all the benefits we gained from this gargantuan project, and take a look at the future of our Elasticsearch cluster.
To keep up-to-date, please follow us on Twitter or Instagram.
Up next: Final architecture & Learnings (Coming early 2023)
Previous blog posts in this series:
- Part 1: Introduction
- Part 2: Two Consistent Clusters
- Part 3: Search Performance & Wildcards
- Part 4: Tokenization and normalization for high recall in all languages
- Part 5: Running two Elasticsearch clients in the same JVM
As we mentioned in the 4th post in this series, we made some backward incompatible changes to our tokenization leading to better recall, therefore we had to account for those differences. ↩
