Our team was challenged with a project that involved performing actions based on plain-text requests. Having little experience in Data Science, Machine Learning (ML) and Natural Language Processing (NLP), our initial approach amounted to nothing more than “AI based on if-else statements”.
To improve our approach, we invited our Data Science team from London to visit us in Berlin. We learned about some services available to us, best practices and the like, but the biggest takeaway was nailing down a methodological workflow, which has become our go-to approach to tackle any data problem.
Read on to learn our Data Science workflow, with a practical example, and see how it can help you in your projects.
A Practical Example - Building a Tech Radar
Meltwater held an internal hackathon recently where I teamed up with a colleague to build a tech radar. A Technology Radar is a living document that makes recommendations as to which technologies the industry should adopt or hold back on. Assessments are based on personal opinions and experiences of engineers who build the radar.
To turn this from an opinion problem into a data problem, we built a “tech popularity” radar powered by news articles from the Meltwater Media Intelligence Platform. An accurate popularity radar would require deep market analysis, but for simplicity’s sake, we used a naive approach of counting occurrences of technical terms in articles and asserting popularity based on those counts. After all, the real purpose of this project was to exercise our Data Science muscles.
Project Requirements
Evaluate a collection of articles that cover topics under 4 main domains:
- Programming Languages
- Data Management
- Software Frameworks
- Infrastructure
Have 4 assessment levels in each domain:
- Adapt - very popular, high confidence in using at work
- Trial - promising with upward trend but with slight risk
- Assess - high risk but still worth investing in some research and prototyping
- Hold - not recommended for new projects
Our Data Science Workflow
Our workflow is a series of linear steps where each step takes an input, processes it and passes the results onto the next one for further processing. Please keep in mind that nothing is set in stone. You can add, remove or reorder steps as you see fit. The beauty of having a plug-and-play model is that each step can be tested and validated separately.

Setting Up Your Dev Environment
We recommend installing the Python Data Science distribution Anaconda. It installs Python and packages for scientific computing such as the Jupyter Notebook, a powerful interactive environment (REPL) that runs on your browser.
brew cask install anaconda

# Add anaconda to your path
export PATH=“/usr/local/anaconda3/bin:\$PATH"

# start Jupyter
jupiter-lab
Training a Prediction Model
Let’s remember our project requirements. A collection of articles enters our workflow, and we need to classify them into 4 domains without any human judgment. This is where a prediction model comes into play to simulate human judgment.
Google offers a series of services to make ML accessible to everyone. AutoML Natural Language is one such service that we’ll be using to train our prediction model. We begin with labeling a dataset containing 1000 articles. The idea is to give the machine enough examples of input and expected output (label) so that it can form a connection between the two. Accuracy of labeling is, therefore, very important to AutoML’s ability to predict.
Let’s examine some body snippets from this dataset:
…Typescript, PostgreSQL and Visual Studio Code all get slathered with a little Microsoft lovin’…
This article mentions both a data management tool and a programming language. It should be labeled as both DataManagement and ProgrammingLanguages. Let’s take a look at a different example that should be labeled as Infrastructure:
…The platform is built on cloud-native technologies such as Kubernetes…
Sometimes you’ll come across false positives:
…Franz Kafka was widely regarded as one of the major figures of 20th-century literature…
This article is not referring to Apache Kafka - the stream processing platform. Therefore, it needs to be labeled as Other.
It is important to have an even distribution of each label in the final dataset. At least 100 text items per label is required for best results. Your final CSV file should look like this:
| “Typescript, PostgreSQL and Visual Studio Code all get slathered with a little Microsoft lovin’…” | DataManagement | ProgrammingLanguages |
| “The platform is built on cloud-native technologies such as Kubernetes…” | Infrastructure | |
| “Franz Kafka was widely regarded as one of the major figures of 20th-century literature…” | Other |
Now you are ready to upload the dataset to AutoML and initiate the training process, which takes about 3 hours. AutoML provides 2 options for programmatically calling your prediction model. You can either directly call the REST API or use the AutoML Python client.
conda install google-cloud-automl
Prediction model responds with a classification score for each label. This number represents AutoML’s confidence in its prediction. Set a threshold that works best for your model and ignore labels below your threshold. Please refer to official documentation on evaluation of your prediction model and precision-recall tradeoff.
Classification
Imagine receiving the following JSON payload when we fetch articles from our data source:
{
  articles: [
    {
      id: “fad9c40e-6aec-4ac8-9e5d-b0f1d7304d8c”,
      body_snippet: “Meet ko, a CLI for fast Kubernetes microservice development in Go”,
    },
    ...
  ]
}
Given the body_snippet, AutoML’s prediction model returns above-threshold scores for both Infrastructure and ProgrammingLanguages labels. We then mutate the JSON object with the labels and repeat the same process until all articles are processed. The mutated entry looks like this:
{
  articles: [
    {
      id: “fad9c40e-6aec-4ac8-9e5d-b0f1d7304d8c”,
      body_snippet: “Meet ko, a CLI for fast Kubernetes microservice development in Go”,
      data_management: False,
      programming_languages: True,
      infrastructure: True,
      software_frameworks: False,
      other: False,
    },
    ...
  ]
}
We pass the entire JSON object to the next step.
Extraction
Extraction is a step in NLP where we identify named entities. For this project, we need to extract technology names such as Java, Hadoop or Kubernetes given an article body. There are a few tools for this purpose; we used spaCy but another great tool is CoreNLP from Stanford.
You might get mixed results in your extraction attempts such as too few or too many entities. In the case of too few, you might have to resort to naive methods such as looking for pre-defined words as substrings in the text. Similarly, in the case of too many extractions, you should exclude terms that are not in your pre-defined list of names.
We mutate our JSON object one more time with the extracted entities:
{
  articles: [
    {
      id: “fad9c40e-6aec-4ac8-9e5d-b0f1d7304d8c”,
      body_snippet: “Meet ko, a CLI for fast Kubernetes microservice development in Go”,
      data_management: False,
      programming_languages: True,
      infrastructure: True,
      software_frameworks: False,
      other: False,
      entities: [“Kubernetes”, “Go”]
    },
    …
  ]
}
Post Logic
Post logic is the step where you would execute domain specific logic. Based on the information gathered during classification and extraction steps, we can build 4 sets (one for each domain) and store technologies along with their counts:

Let’s take min, median and mean of each set and define some thresholds based on that:
Hold: min == count
Assess: min < count <= median
Trial: median < count <= mean
Adopt: count > mean
As we assess each domain using above formula, we are going to generate a final data structure that summarizes the results in a concise way.
[
  {
    "classification": "programming_languages",
    "technology": "javascript",
    "action": "adopt"
  },
  ...
]
We’ll conclude this step by making the results accessible to external components, specifically the UI component. Simply convert the data structure to JSON and upload to S3.
Visualizing the Tech Radar
Zalando’s radar.js is a great way to visualize a tech radar. All we need is a bit of Javascript to fetch and apply the data points.

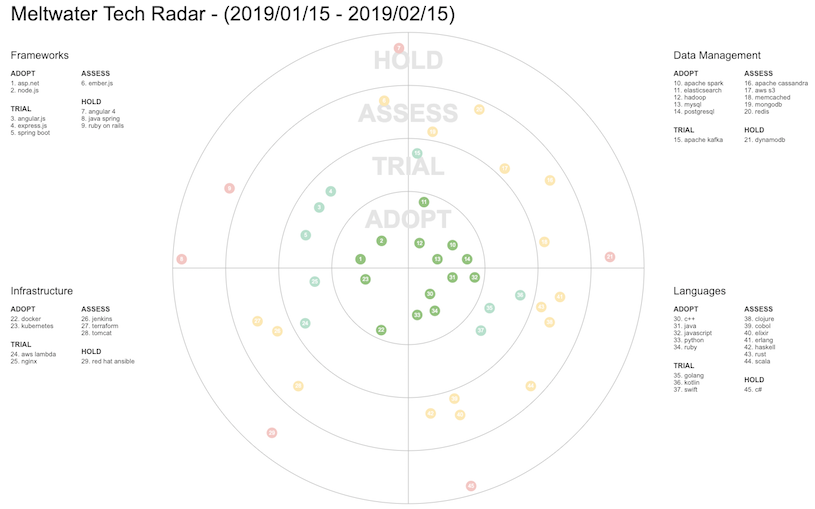
Looking back at our project requirements, we’ve successfully classified articles into 4 domains and assessed popularity of technologies within the context of their domain. The Tech Radar UI component has enabled us to present our findings in a logical way; innermost circle is densely populated with technologies generating the most buzz on the internet, and as we move away from the center, we see technologies with relatively fewer mentions.
A couple of improvement ideas quickly emerged while developing the radar. First, use data sources that are exclusively focused on software development to reduce noise and false positives. Second, understand the sentiment in the articles to accurately measure industry trends. For instance, if we encounter several articles where engineers mention how they switched from Java to Kotlin, this would indicate a downward trend for Java and upward trend for Kotlin. NLP services that we used for extraction also offer sentiment analysis.
Final Thoughts
If your development team is similar to ours, you might have avoided using data science as a tool to tackle problems, due to not knowing when or how to apply its techniques. Even though we have only scratched the surface of a vast topic during this project, we have learned that through readily available tools like AutoML, many data-driven problems can be automated.
So what is next for you: If you recognize a process at your job that depends on human intuition, why not try the data science techniques explored in this article? You may discover more automated and sustainable ways to solve such problems.
Image Credits:
Alinur Goksel - Meltwater
Leonid Batyuk - Meltwater
