Our Application Framework team was tasked with assessing and improving application performance. Analyzing performance across the globe is challenging. The architectural layout of Meltwater’s application, as well as the way we organize our teams, lead to various challenges.
This is the first post in a series about front-end performance. We will share how our Application Framework team went about assessing the current performance of our app. Continual monitoring and relative metrics are a cornerstone to build from when focusing on performance. Here is how we laid our cornerstone.
Application team structure at Meltwater
After being asked to debug app performance issues in specific geographical regions, our team quickly realized we had near zero insight into app metrics. The application features are managed from the ground up by separate development teams who handle everything from coding to ops. Meltwaters product can be thought of as a suite of applications all working together seamlessly. These independent features applications are stitched together to appear as a single unified application. This application structure provides a unique challenge in both overall performance and collection of metrics.
What experience do users expect?
Many of the current web apps on the internet today are structured as a single page application (SPA). SPAs often utilize a framework such as React, Angular, Vue, etc. These types of applications bundle together code and dynamically change the content on the user’s page without performing a reload, even when navigating to different pages. SPAs download almost all of their code “up-front”. The result is the very first load is usually rather slow, but navigating around the web app is blazing fast. SPA is a common pattern around the web and an experience that has become familiar to users of the internet.
So, what experience does our app provide?
Due to the nature of how our teams are structured, each feature is essentially an individual website. This structure means that as a user navigates from feature to feature, they are loading a new application, this is referred to as a multi-SPA. Each feature may be built on a different framework, feature A uses AngularJS, feature B uses React.
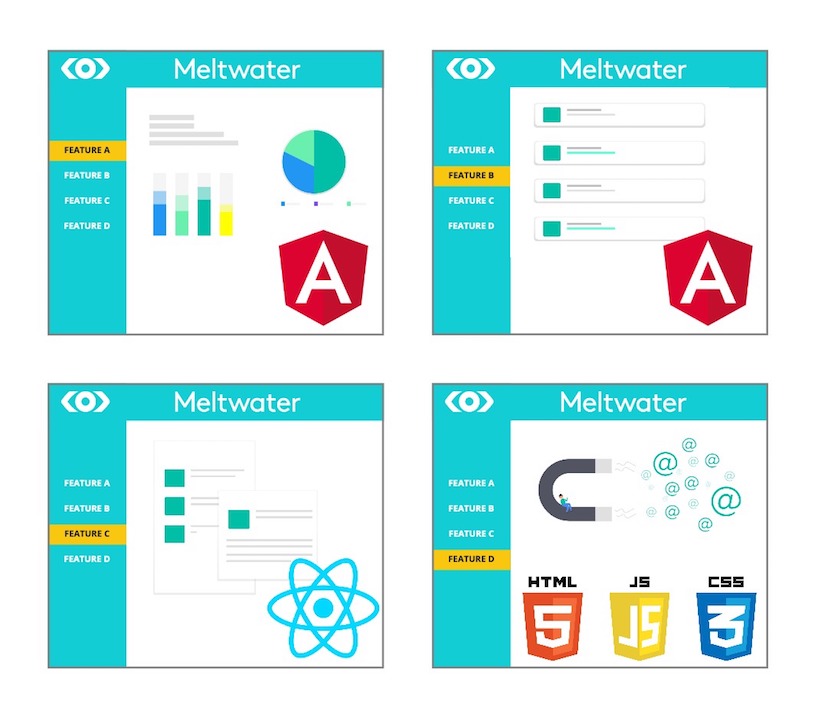
Multi-SPAs allow teams to make choices in the technologies they use while presenting a unified experience as a product. Users who are expecting a single-SPA style experience with snappy navigation will occasionally find the experience jarring, even with a fast internet connection.
Compounding the problem
As developers, we mostly use and test our application in the same geographical area where we develop it. We have excellent internet connections and high-end computers. When end users complain about “slowness” we often cannot replicate the experience. As technical-minded people, web developers find it difficult to quantify “slow.” After hearing a complaint, we immediately open up our browsers, navigate to our production app, and mutter the classic response, “it works fine on my machine.”
What we often don’t consider during our daily work is how the rest of the world experiences our application. The internet is an intricate house of cards, and we cannot just slap our assets on a Content Delivery Network (CDN) and walk away. Many factors still affect end-user performance. Some of which are out of our control as developers such as available internet speeds in the user’s region, or content restrictions in the user’s country. There are many technical factors we can control, look for those in a later part of this series.
How to turn “slow” into data
It is difficult to assess and debug “slow”. These types of terms are subjective and opinionated. Does the user have unrealistic expectations? Perhaps they were just having a bad day. We needed to quantify performance.
To begin collecting data we turned to a tool called Catchpoint that provides synthetic monitoring from any of hundreds of servers around the world. This tool provides testing not only from certain geographical locations but also specific ISPs.
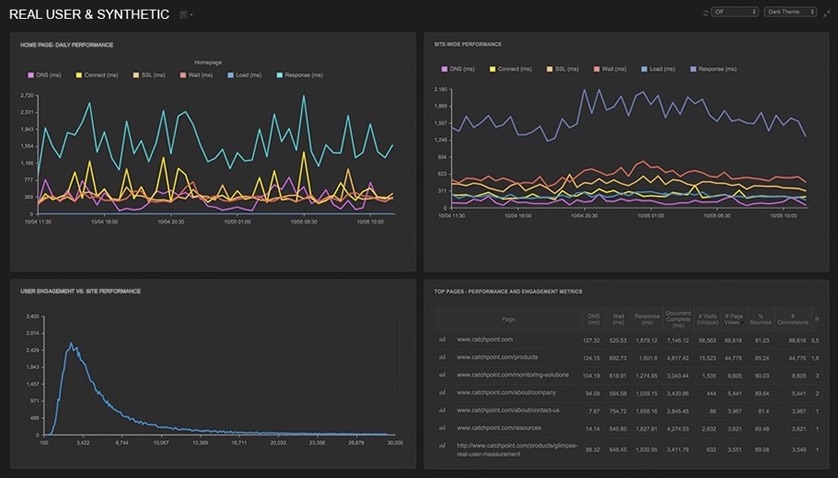
Using selenium scripts, we can log in and navigate to different pages within the application, gathering a plethora of metrics for each “step” of navigating throughout the app. Full network traffic collection provides waterfall views of every step, as well as the timing of every network request. Test results also provide the number of bytes downloaded, time to first paint, time to interactive, even a film strip of screenshots as the page loaded.
We went from zero insight to a full firehose of information instantly.
The amount of data we suddenly had access to was overwhelming. Real metrics on what it was like to load our application across the globe. We could finally quantify our application!
Something was missing
After sifting through the mountain of data and organizing what was useful and what was not, stakeholders wanted to know what we found. We were presented with a challenge we hadn’t expected. How do we take this performance data and make it easy to consume? The solution was surprising; we needed more metrics!
Custom metrics — MITTI was born
We were looking for a single metric to evaluate how quickly our application loaded. A natural candidate for this was time to interactive (TTI). This metric was not an accurate representation of when a user can start using our app. After the browser loads all the required resources, the page is technically “interactive,” however, our application needs to make API calls to fetch information for display to the user, and the app content is disabled until the data is ready. As far as the browser is concerned, the page is available for interaction, but the user is shown a disabled UI. We needed a metric that showed how long it took for our code to fetch the required data and enable the page for the user. We would name this new metric Media Intelligence Time To Interactive (MITTI), “Media Intelligence” being a term for our application internally.
We needed a new metric, we knew what it should measure, we even knew what we wanted to call it, but how can we collect it? Luckily we knew where in our application code the app was enabled for the user. In a script included by all the feature teams apps, we added code to log this time and added a function to the window object that our selenium script uses to fetch the value. Now in our Catchpoint script, we can quickly get the value using code like this:
runScript("var our_custom_metric = window.getOurCustomMetric();")
Now we had the value we wanted in a variable in our testing script. Catchpoint allows us to store this custom metric along with all the other data it collects (the implementation of custom metrics storage will depend on your choice of monitoring tool).
We could now create easy to consume graphs and reports showing objective values for app load speed across the globe!
Trouble in paradise
Developers across the feature teams were intrigued and started implementing changes to improve performance and intently turned to our dashboards to measure the improvements they made.
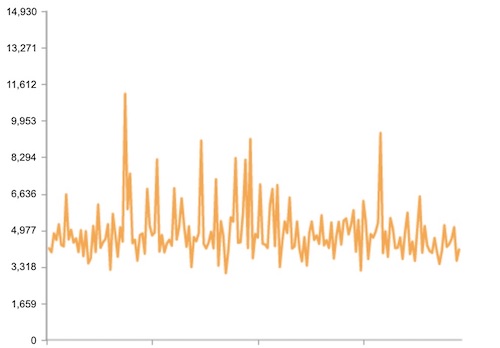
It was not as easy as expected to quantify the impact of these improvements on our app. An individual location/ISP combination is only tested every six hours, and a team could have to wait a full working day to check their changes in some cases.
The data collected by the monitoring tool was also very “real” and inherently noisy. Averaging the data out over time was powerful but did not help a team trying to check their improvements without waiting a week to average a reasonable amount of data.
More metrics? Seriously?
Yup. We needed a way to help enable feature-teams to quantify their improvements quickly and repeatably. A new set of metrics collection is by no means a replacement to our synthetic monitoring but rather a supplement. To achieve this we used Sitespeed, an open-source tool for evaluating web performance. We configured it to provide the metrics we care about (including our custom metric, MITTI). Sitespeed also provides reports on performance with a “performance score” and suggestions to improve performance, these features are available out of the box.
The goal of Sitespeed tests is to provide a consistent and up to date benchmark for teams to test their code changes. We configured Sitespeed to collect metrics on both our staging and production environments. Having metrics against staging is vital to enable speedy development cycles for teams. We also configured staging to run every 2 hours, ensuring that multiple sets of data get collected within a single day. To provide repeatable data to teams, we configured the Sitespeed instance to run in a single specific region with a stable connection. The connection speed was throttled to 5 Mb/s to help regulate any irregularity in connection speed that may influence metrics. Throttling creates data that may not be precisely true to end-user experience in the region. Still, it does provide a very repeatable set of data for engineers to measure against when making changes and deploying.
Key takeaways
To gain true insight into app performance, one must monitor and gather metrics from multiple angles. A broad approach is accomplished using numerous tools and analyzing which metrics are most important to the end-users of our application.
Performance is a mindset. Monitoring tools and metrics must be adapted into the workflow of developers who must continually consider the impact of their code. Monitoring tools are an aid to deliver the best possible user experience.
