To provide structured data from the Web to our customers, our team maintains a web crawler. The system downloads and processes 600K URLs per hour, resulting in huge amounts of logs. That costs a lot!
In this blog post, Róbert from our Crawler team explains how we modified our architecture to save 40k USD/year on logging.
Why Do We Need Such a Large Amount of Logs?
The most trivial way to save money on logging is to simply decrease its volume. That is why we are continuously reviewing our components to make sure that all we need is logged (on the appropriate level) but nothing more. However, the amount of logs we need is still large. To reflect on the importance of these logs, let me quote a fellow colleague:
We only need logs to trace things back when something strange happens - which is not an irregular thing in the world of crawling. When that happens we need logs badly. All the metrics and insights given by logs are just additional goods at the top and basically come for free.
How It Worked Before
Some of our crawling components run as AWS Lambda functions on the Java runtime.
For logging we rely on a service provided by the Foundation Team, a team at Meltwater that fosters developer productivity by providing an engineering infrastructure to build upon. Their service is a self-hosted, extended and customized ELK stack. If you want to know more about that logging service, we recommend reading Load-driven Shard Distribution in Elasticsearch.
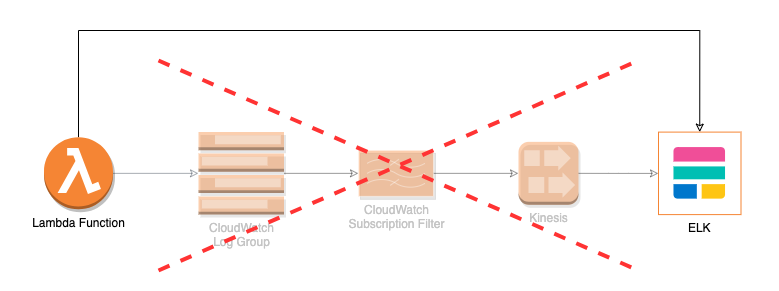
At the beginning, we followed the practice of logging to the standard output from our Java functions, so we had all our data in CloudWatch Log Groups. Then we configured Subscription Filters to stream the log entries to Foundation’s Kinesis Stream. From there, Foundation looked after consuming our logs into their system. This was all super easy, fast to set up and worked seamlessly, since it is the common pattern for forwarding Lambda logs to the ELK used in Meltwater.

However things became concerning when we started to produce more and more logs, and our costs were ramping up.
Exploring Costs
In order to have a clearer picture of our costs we tagged all of our AWS resources, which gave us a long list in Cost Explorer that we ordered by costs. One of the top items turned out to be CloudWatch. During our investigation we found that the majority of costs came from Data Ingestion. The CloudWatch pricing documentation also confirmed it by stating ingestion is billed for $0.57 per GB in Europe (Ireland) region.
We asked ourselves, is it worth ~100 USD a day to have an additional setup only for forwarding the data to the ELK stack? Is there any other, less expensive, way to get our logs into ELK?
Of course there is!
Another Way
We have other components running as dockerized Java applications on ECS, which send logs directly to ELK over TCP. Great! If we could do the same from Lambdas, we would skip CloudWatch completely and save the money spent on ingestion. So Logback Logstash TCP Appender to the rescue!

Why Did Not We Do This In The First Place?
Firstly, following common patterns for common problems always seems like the most reasonable thing to do. Since other teams also streamed their logs to ELK through CloudWatch Logs, we did not want to reinvent the wheel.
Secondly, there is a major problem with using the asynchronous TCP appender in Lambdas. Once the main function exits, AWS cannot guarantee whether the Lambda instance will be reused later on or torn down. The asynchronous TCP appender uses background threads to send log messages to Logstash. If the main thread does not wait for them to finish sending, it can potentially lead to message loss (if the Lambda instance gets shut down) or delay in message delivery (if the Lambda instance gets frozen until the next execution).
As we mentioned earlier, having consistent and dependable logs is highly important to us. So we cannot live with delayed message delivery nor message loss, but we felt this was something we could sort out easily, if we could flush the appender at the end of each invocation. We also wanted to know its impact on the duration of our Lambda functions since our main function would wait for all log messages to be sent successfully to ELK.
The Trick
We dug into the SLF4J and Logback APIs, and found out how to restart the appender. Calling the stop() method eventually waits for flushing all messages:
LoggerContext loggerContext = (LoggerContext) LoggerFactory.getILoggerFactory();

Appender<ILoggingEvent> logstashAppender = loggerContext
        .getLogger(Logger.ROOT_LOGGER_NAME)
        .getAppender(LOGSTASH_APPENDER_NAME);

if (logstashAppender == null) {
    log.warn("Logstash Appender cannot be found.");
} else {
    logstashAppender.stop();
    logstashAppender.start();
}
After applying this appender-restart in the finally block of each of our main functions, we removed the aforementioned Subscription Filters to Foundation’s Kinesis stream. Lambda logs are now sent directly to ELK, and not streamed through CloudWatch.
Conclusion
Reaching the underlying Logback implementation through a high-level abstraction of SLF4J API is not the prettiest thing to do, but for saving ~100 USD per day we can bear the pain. It saved almost all of our CloudWatch costs, around 36,000 USD a year. And it did so without causing any noticeable impact on our Lambda’s performance and execution duration.
Overall, we are quite happy with this solution. It is cheaper, simpler and involves less components while it is as much reliable as the earlier setup.
We are always keen to improve, so feel free to reach out to us to share your thoughts, give us advice or ask any question! Just leave a comment below!
