Haven’t we all been a bit nervous at times about pressing that “Deploy” button, even with amazing test coverage? Especially in the scary world of microservices (aka distributed systems) where the exact constellation of services and their versions is hard to predict.
In this post I will introduce the Synthetic Monitoring concept, which can make you feel more confident about your production system because you find errors quicker. It focuses on improving your Mean Time to Recovery (MTTR), and gathering valuable metrics on how your whole system behaves.
The idea of Synthetic Monitoring is that you monitor your application in production based on how an actual user interacts with it. You can picture it as a watchdog that checks that your system is behaving the way it is supposed to. If something is wrong you get notified and can fix the problem. Our team arrived at using this technique without really knowing that it was an already established concept.
Test suites are a great way to prevent errors from making it to production, improving the Mean Time between Failures (MTBF). However even with solid test coverage things can go wrong when going live, maybe something is misconfigured, a gateway is down, one of the services we depend on has issues, or simply lacking test coverage. When something goes wrong in production we want a low MTTR so user impact is kept to a minimum.
Our Problem
The Meltwater API is comprised of many different components, which may be deployed multiple times a day. Our components also have dependencies on other internal and external services. Including all these services in local or CI tests is slow or brittle at best, but in some cases not feasible.
This realization prompted us to develop a set of contract tests that check that the API is behaving as specified in our documentation, and hence the users of our APIs actually get what they expect. If any of the checks fail we want to be notified about it.
Solutions
Approach 1: Postman
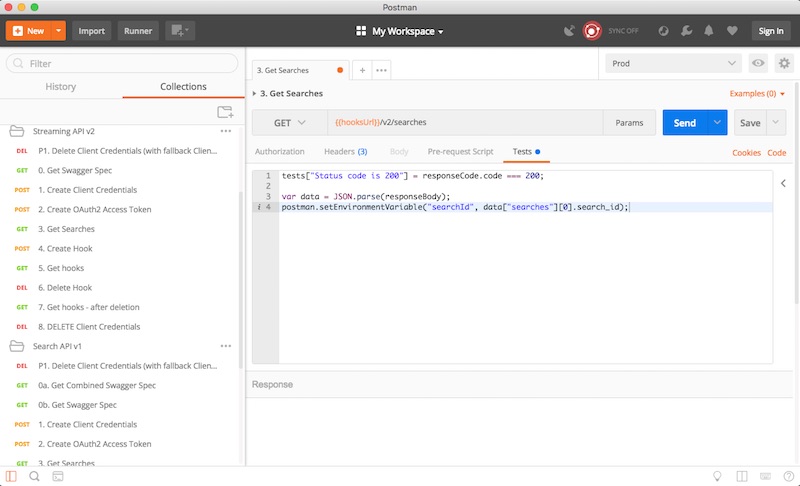
We started by creating a collection of HTTP requests for our external facing endpoints in Postman. Postman is a tool for API development. You can run HTTP requests, create test cases based on those and gather your test cases into collections. After every deployment we ran all of the Postman tests as a manual procedure against production to detect any signs of smoke. If something failed we could make the decision to either roll back or roll forward.
Even though we moved away from this approach quickly, we still sometimes use this Postman collection for manual testing.
Approach 2: Newman
The manual approach quickly got old as we increased the number of deployments per day. Newman to the rescue! Newman is a command line interface and library for Postman. We built a small service around Newman to run our Postman collection every five minutes and notify us via OpsGenie (an incident management software we use) in case of failure.
Approach 3: A custom monitor service
The Postman+Newman combination eventually surfaced some annoyances and shortcomings for our team as we relied on it more and more:
- Writing test cases in JSON is limiting, hard to read, and does not give you much flexibility in terms of sharing functionality between tests.
- Another issue was that we wanted more and better instrumentation, and reporting capabilities.
- We wanted to broaden the coverage of the monitoring a little bit. This meant introducing a small set of more whitebox type tests to detect other type of problems, and those tests need to do more things than just HTTP requests.
So we rolled our own solution. The good thing about having gone from manual to an automated solution beforehand was that we knew exactly what we wanted.
Defining test cases
We wanted to write tests in a proper programming language. This way you get the full power and flexibility of the language. You get help from your editor and the compiler. You can share code between tests. Below is a snippet from a test case that makes sure it’s possible to create a search:
defmodule MonitorService.Case.CreateSearch do
  @moduledoc """
  Verify that we can create a new search
  """
  use MonitorService.Case

  def test(context) do
    now = DateTime.to_iso8601(DateTime.utc_now())
    name = "#{name_prefix()}_#{now}"

    search = create_search(name, context.user_key, context.access_token)

    assert search["name"] == name
  end
end
By using Elixir’s built-in ExUnit assertions we get the benefits of helpful, informative error messages.
Report output
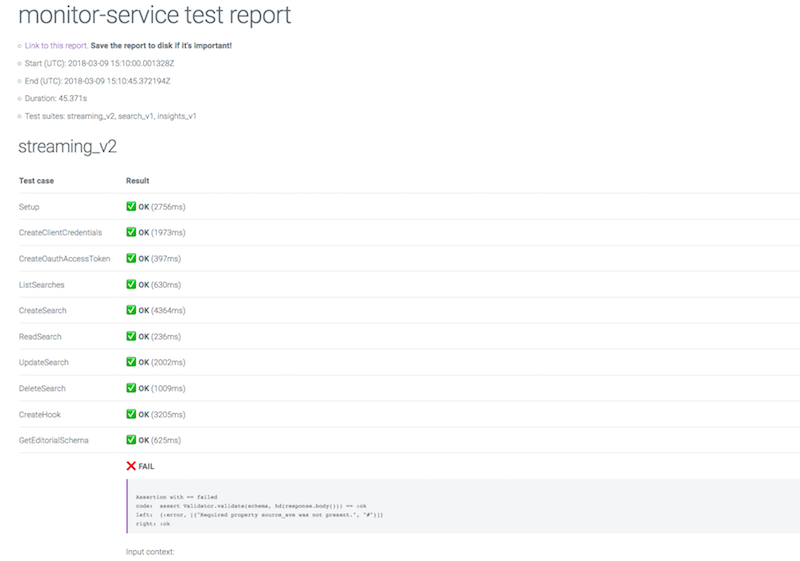
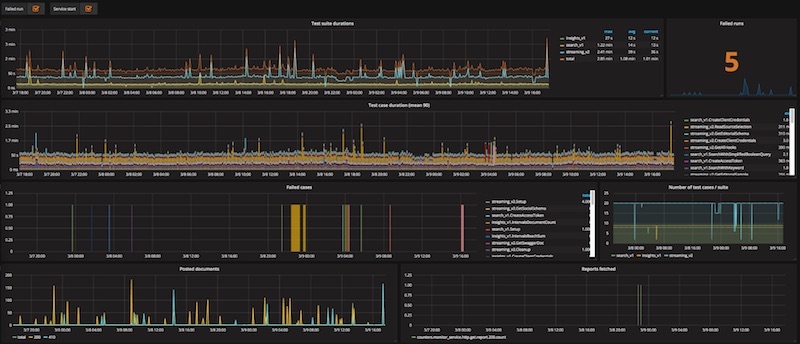
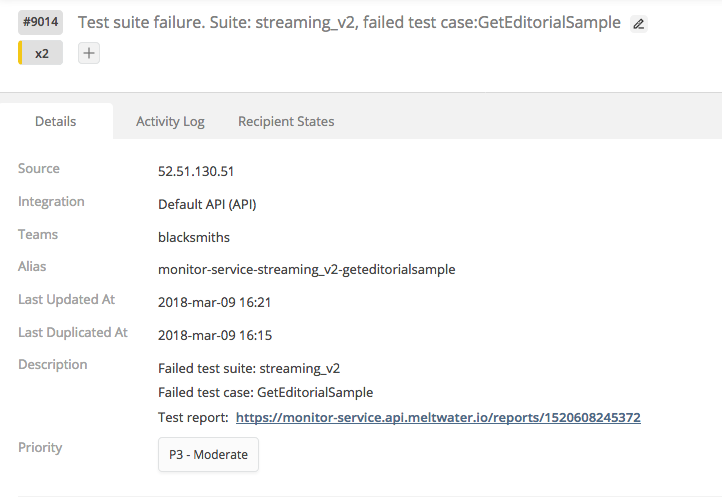
We knew we wanted different types of reports based on the results of the test runs. OpsGenie alerts were the minimum requirement so that we could notify the engineer on call. HTML reports has proven to be useful to get a first rough idea of what’s wrong. We also have statsd metrics for test suites, and individual test cases - this helps us understand what test cases are failing the most, which ones are slow etc. Finally there’s a Slack reporter that sends messages about failed runs to a specified room.
Other nice-to-haves
- Cron like schedule definition
- Simple to run locally
- API endpoints to interact with the service (pause it, list suites etc)
- Fine grained logs to be able to follow runs easily
Example outputs
HTML test report:
Grafana dashboard:
OpsGenie alert:
Results
The first thing that happened when putting our initial automated setup in place was that we saw a lot of problems. Problems everywhere! We found bugs in our own components, and plenty of issues with depending services, including 3rd party ones. Timeouts, 5xx responses, incorrect status codes, etc. We also realized we had put too much trust in the network, and that our alerts were very sensitive and hence noisy.
Luckily we found these things before our API went into the first beta stage, so we were able to fix all the issues before offering this product to our customers.
However this experience prompted us to make our components more resilient to intermittent issues. Retry mechanisms are great for this. We also tweaked the monitor service’s timeouts, and made it only trigger OpsGenie alerts if an error happened twice in a row.
Conclusion
We have been running the latest incarnation of this setup in production since early 2017 with good results. We’ve made our system more stable and self-healing, reducing the number of incidents drastically. We’ve also notified maintainers of services we depend on about bugs, performance issues and other surprises. Still we repeatedly find out about 3rd party (or internal) service outages before they are announced! When this happens we can quickly make sure our customers are aware of the problem by updating our status page. Bad deployments are caught very quickly, we had one instance where our streaming API started pushing double encoded JSON payloads - the monitor service caught it, we rolled back, added a test case, fix, and re-deployed within 10 minutes.
As for the implementation we are very happy that we took the route we did. Starting with something manual and then gradually automating that solution helped immensely. So if you team has nothing like this in place yet, you could try out Postman as a quick way to get started.
Finally the possibilities for a monitor service like this are endless - you can automatically close alerts if a failing test case starts passing, you can automatically update your status page, notify other teams, maybe map failed runs to specific deployments, do automatic rollback, and the list goes on. Synthetic Monitoring is an integral part of our system now, and a huge confidence booster.
Are you using this technique as well? What are your experiences? What tools do you use? We’d love to hear about your setup and learnings, and answer any questions in the comments below.
