What starts like a joke is really a serious post about large distributed systems. This is what we run at meltwater - and while there is a lot of fun designing and administering these systems, we run into odd problems from time to time. In this case: some well-meant Red Hat memory optimisations interfering with Riak performance.
There is a lot of talk around “Big Data” in the industry - and here at meltwater, it is day-to-day business. We currently have a working group preparing the switch to a new database system as we’ll overflow a 32bit integer in our editorial document ID list in a couple of months. Recently, we released the new meltwater media insights application. It has been designed from ground up to scale over the next years - with problems like that integer overflow we’re facing in the legacy systems in mind. The basic mission of the architecture behind this new product is to crawl and ingest a variety of digital media, enrich that raw data using data science and natural language processing, then index the results for statistical analysis and reporting. We also store off the data enrichments for future reference in a data storage system. For indexing we selected Elastic(search) and our enrichments are saved into Riak. The pipeline that feeds these subsystems has a constant requirement to sustain at least a 1000 documents per second (DPS) ingestion rate. To put that into perspective - while one rarely has more than a couple of million rows in a database for traditional use cases, we are dealing with 1.5 billion entries into our system per month.
Moar Data
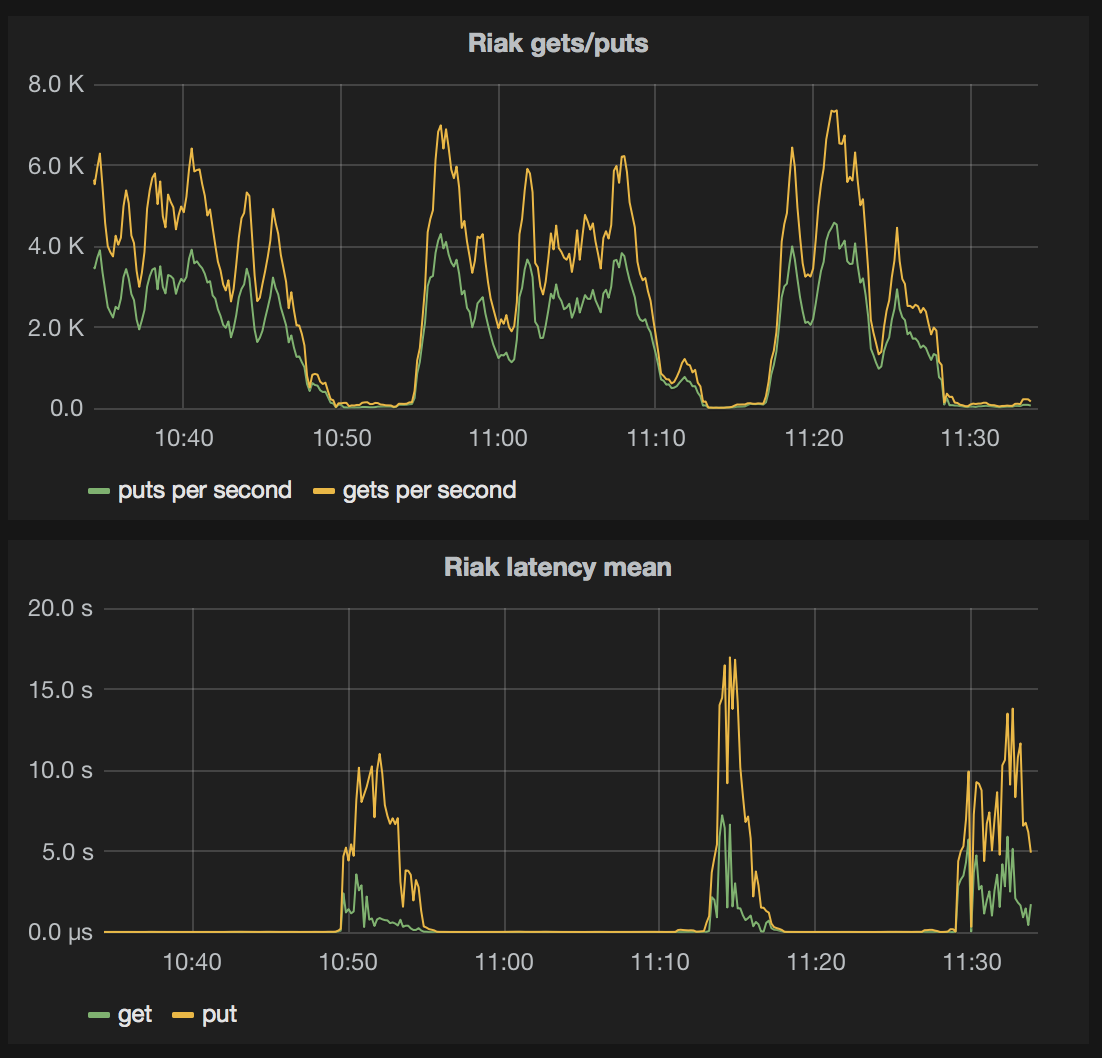
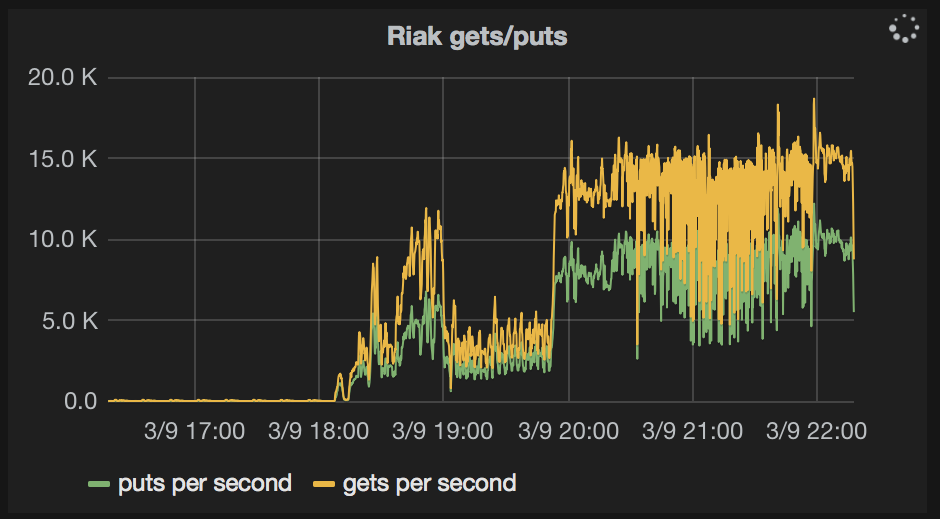
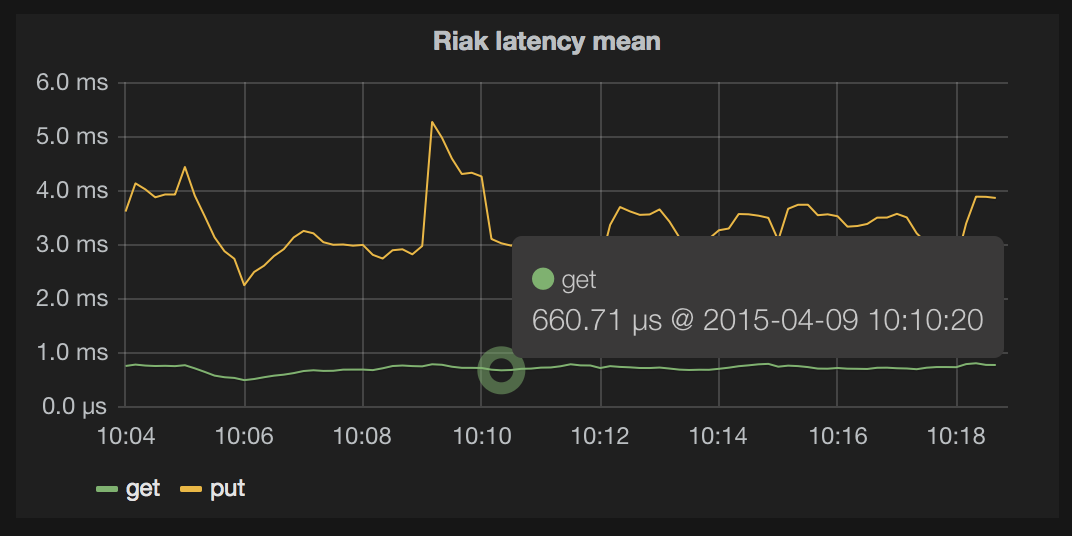
Recently, we began a process to update historical data in the system and this process required a DPS rate exceeding 3000. We should be in good shape to accomodate these higher DPS rates because our Riak cluster consists of 8 nodes with a dual Xeon E5-2630v3, 384GB of Ram, a 3TB FusionIO X300 PCIe flash card and a 7.8TB Raid 5 over 10k spinners - all in a Dell R630 chassis. Pretty sweet setup, scaled up for density and horizontally scalable for our future data requirements. We had just restarted all the processes to apply an OS patch, as we believe in security over uptime. The systems we chose - Elasticsearch and Riak - support those rolling restarts, staying up and running while machine after machine goes down and comes back up. Riak was generally working fine and ingesting the data smoothly as we ramped our our data processing jobs. After a while, though, Riak went into pauses every couple of minutes, ingesting only the bare minimum of data - dropping from a peak of almost 3000 DPS initially down to 1200 DPS and eventually down to only 20. Throughput was directly related to the mean latency for gets and puts in Riak, and it looked like this:
Valleys and Spikes
The longer Riak was up, the longer the pauses got - and more frequent as well. This also meant, the rabbitMQ queues would fill up, and at some point, like a queue having over 2 million data points or more than 5 million data points in total, hang itself up. Not crash - which would have been handled gracefully - but hang, still accepting data, but not handing it out any more. Failing over to the passive rabbitMQ node and failing back to the original active node always lost data, which then had to be played back from backup. Let’s say, this was a very unfortunate situation, as it needed constant babysitting and even System Administrators have to have a weekend every now and then. Solving the main issue - Riak going into pauses - was really important at this point. We built a task force consisting of backend engineers, a system architect, Operations engineers and senior SysAdmins from our Datacenter partner, Basefarm. At first we started looking into IO. A high IOWait during those pauses would have been expected, and easily caught withiostat -xm 2
But as it turned out, there was none. All the while User CPU and IOWait dropped down, while it would have been expected to go up. The only thing that went up was the load average on the server (which is rarely a good indicator for a specific problem, but indicates a general problem).
It’s always disk IO - or is it?
The only thing we noticed inside Riak, that correlated to the elevated load, was that it dropped its internal caching structures, the ETS tables. This was pointing to a memory issue. Using operf (oprofile) we were able to find what was going on during those pauses - a process called numad was the only process using resources. In short: numad is responsible to move memory pages onto the physical memory banks of the CPU that most often accesses these. This makes the Ram access faster. numad has been an addition to RHEL in 6.4 and is enabled by default, but the Red Hat documentation says:
Systems with continuous unpredictable memory access patterns, such as large in-memory databases, are also unlikely to benefit from numad use.
And this is exactly what Riak is - a large database, easily using 100GB and more of the 384GB available in each of the 8 nodes we run it on. So we decided to turn numad off, waited for the next spike to occur a couple minutes later - they were pretty regular at this point in 12 minute intervals - and nothing happened. Riak just continued to ingest data, continuously, without long pauses. Success! Next up was Elasticsearch and checking the behaviour of the relatively large JVM heaps (30GB) in conjunction with numad as well. We were seeing relatively simple queries against Elasticsearch taking suspiciously long, but only occasionally. In the numad logs on those machines, one could find:Sat Mar 14 06:04:04 2015: Advising pid 32434 (java) move from nodes (1) to nodes (0)
Sat Mar 14 06:07:01 2015: PID 32434 moved to node(s) 0 in 177.10 seconds
Sat Mar 14 06:07:06 2015: Advising pid 31808 (java) move from nodes (0) to nodes (1)
Sat Mar 14 06:07:11 2015: PID 31808 moved to node(s) 1 in 4.83 seconds
And these pauses correlated both with the Riak spikes in load and the Elasticsearch slow queries we saw.
Are we there yet?
This should have solved it. We disabled numad through puppet for all Riak and Elasticsearch nodes we run and killed it. And the spikes were history - or, were they? There was still somewhat strange behaviour. Generally, it was no problem to sustain up to 2000 dps throughput. But about 2 or 3 times per day it would drop below 600 dps, which means the queues would fill up again. Sometimes it would stay below that for half an hour and then go up again, allowing the queues to drain; sometimes it would stay up and the queues would fill beyond 1.5M entries, in which case we would dump the data onto disk temporarily, to play it back later. The intervals in which this occurred were much longer and the effects not as drastic as before. Running the profiling again and monitoring system performance did not reveal anything obvious.
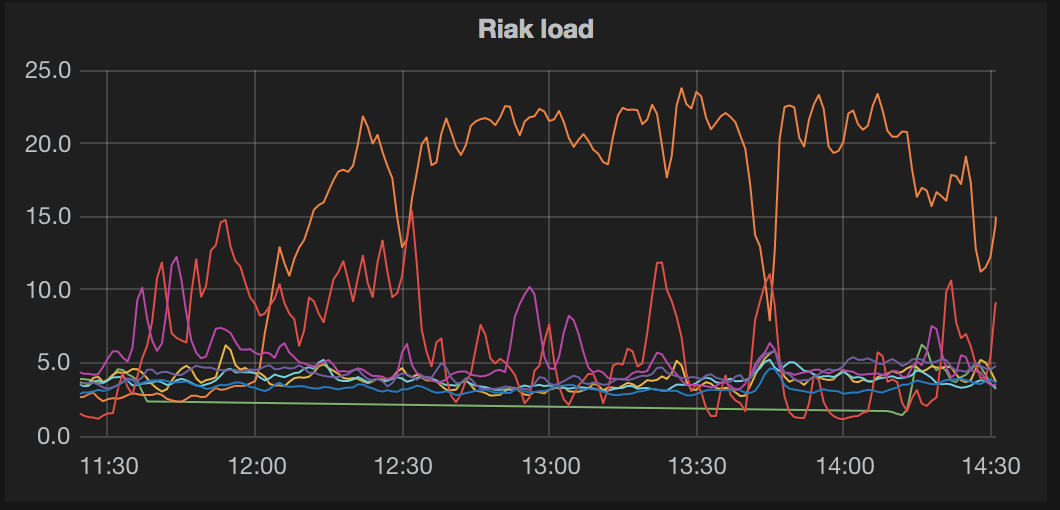
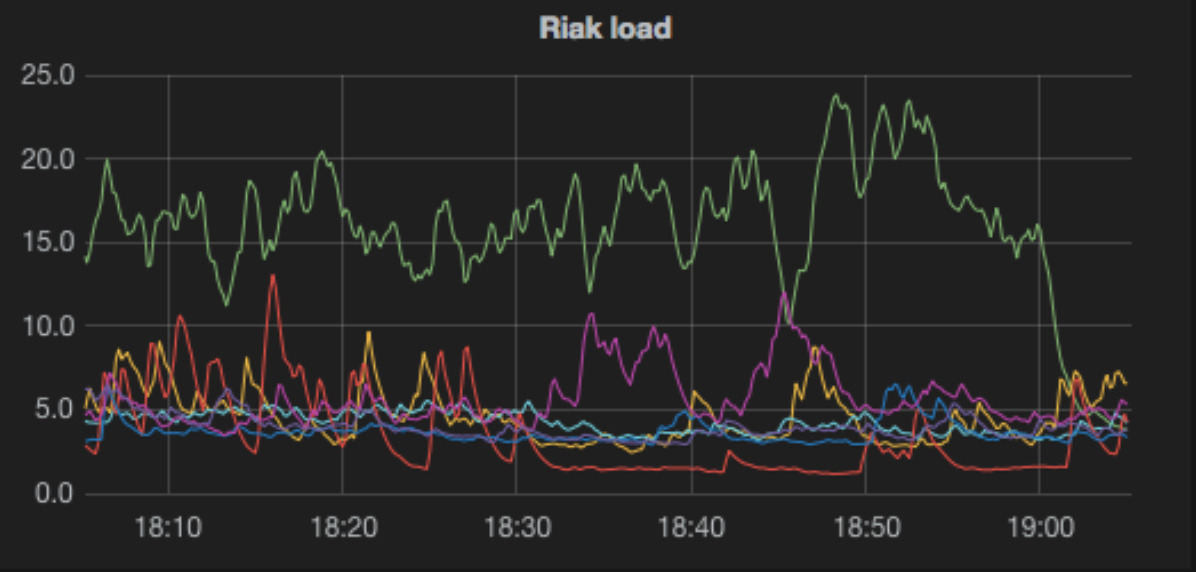
The only thing really noticeable was that it seemed to be one or two nodes slowing down the whole cluster. This is somehow by design - to know the data has been written securely to all three nodes which hold copies, the client has to wait for 2 (quorum) or all nodes to accept the write. So a single node being slow can drop the overall throughput significantly. The pattern of a single node being slow looked like this in load average:
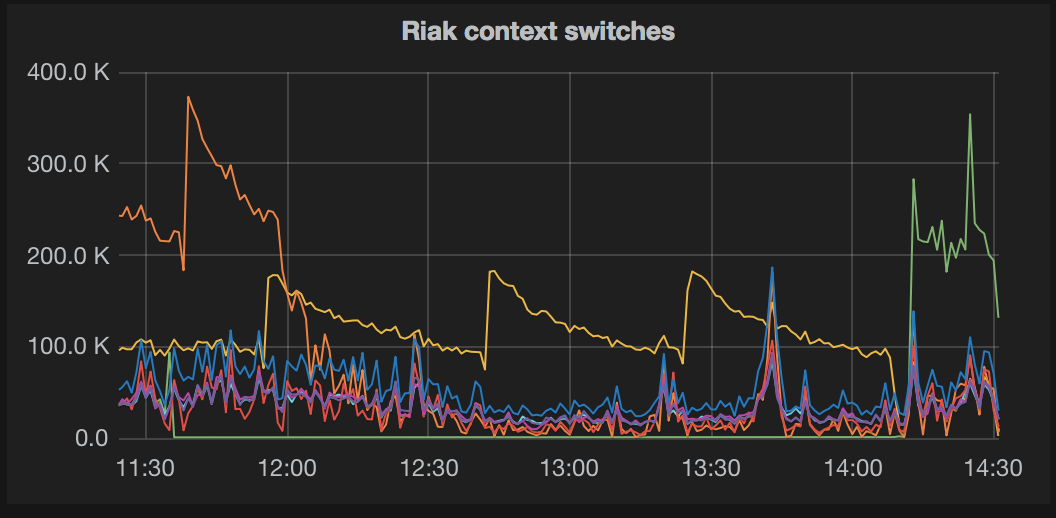
More significantly though it showed up in context switches:
One thing that stood out was all machines had at least 5% System CPU usage - a thing we rarely see on other machines. System CPU means processor time spent in kernel calls, and one usually sees it spiking up to about 10% (again iostat or top would reveal this) for a second or two, then go back to less than a percent. But constantly using significant CPU resources seemed suspicious. By now, all possible problems with the IO system were ruled out, so the task force got together and there was weeping and gnashing of teeth, as this meant: it’s the Kernel. Anyone who was ever in the situation of having to install the debug symbols knows what situation we were in. With some sarcastic and fatalistic humour, the first and most obvious suggestion was to pipe /dev/urandom into random files in /sys/kernel, but we quickly agreed on a more systematic approach. It probably:
- again had to do with memory,
- was due to something specific to RHEL and/or
- introduced into RHEL relatively recently to not be optimised in the wild,
- showing as elevated system CPU.
So with that, we went on a research and found a pointer in the relatively low number of page faults whenever a node would go slow - this could of course have been a symptom, but in this case it looked like the cause, memory access being slow. Ultimately, the following line from the Red Hat documentation around Transparent Hugepages (THP) made us suspicious:
However, THP is not recommended for database workloads.
Again, like with numad, it is a good intention to make memory administration easier. Working with huge pages directly is complex and rarely used - it gives benefit though to certain application workloads. Transparent Hugepages promise to give these benefits to normal programs which use traditional memory allocation. As THP is really only an optimisation, and as it can be tuned through /sys/kernel, we just gave it a shot on one of the nodes that was having troubles:echo 'never' > /sys/kernel/mm/redhat_transparent_hugepage/enabled
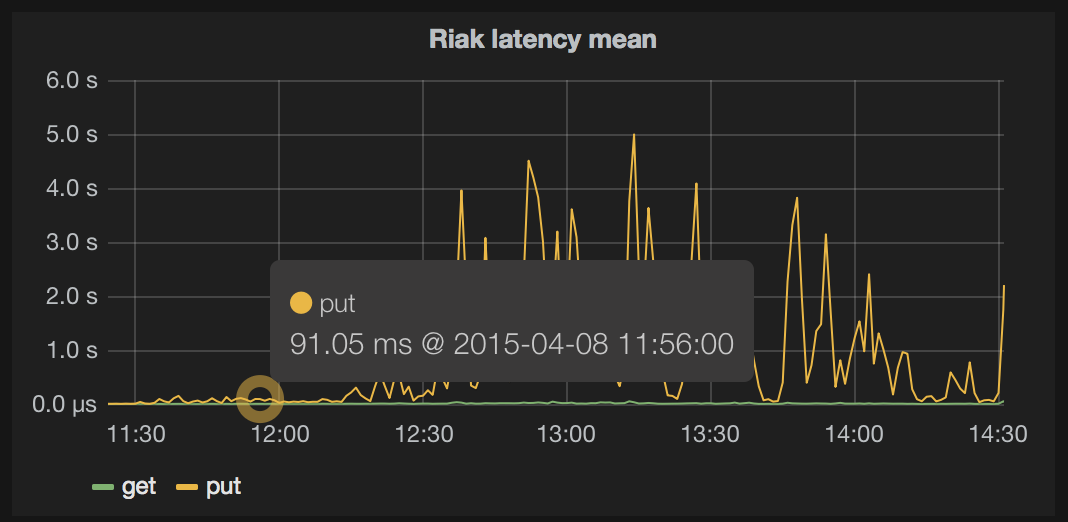
And this did the trick:
In this case, it’s not as trivial to permanently disable it as it was with numad, though. The easiest thing is to have a custom rc.d script to disable it after boot. But: tuned/ktune has it in standard profiles, so you would need to change that as well. Disabling it in grub.conf seems to be prevented by a bug, but doesn’t hurt either. With the change to disable THP made on all machines, our throughput is higher than ever, and latency is way down.
Summary
When running multi-threaded, multi-GB heap processes like Riak or Elasticsearch, the default configuration of Red Hat Enterprise Linux 6.4 and later versions can lead to performance issues. The automatic numa management through numad can result in long (120+ seconds) application pauses. The Transparent HugePage (THP) feature can slow down memory access and through that increase latency of your applications.
We think it is worth investigating the behaviour of numad and THP on all systems that run software like Riak, Cassandra, Redis (see their suggestions about THP), Elasticsearch, Solr, Couchbase or other multithreaded systems with a large (multi GB) heap. There is also evidence which we’re investigating further that MySQL might be negatively affected by numad. We hope to feed back these findings to all Open Source projects we use, so it can be added to their documentation.
