![]()
Jupyter is a popular web framework used with Python to easily visualize and manipulate data. It can display the results of many databases using the Pandas library, but the popular Gremlin graph query language hasn’t been supported.
To solve this problem we created and open-sourced JUGRI to show your Gremlin query results in the Jupyter Notebook. So if you are a Data Scientist using Python, and want to visualize your Gremlin graph queries using Jupyter, then JUGRI can be a handy addition to your toolbox.
What is Jupyter?
Jupyter is an open source tool to display the output of scripts that are run in a spawned process in the so-called kernels in the web browser. It supports many languages, however, it is mostly used in conjunction with Python and the popular Pandas library. These are the number one tools in any Python Data Scientist’s toolbox. The library can process and display tabular data in an efficient and well readable way. It has connectors to read many sources like CSV files or SQL databases. Unfortunately, it does not have support for the Gremlin query language.
What is Gremlin?
Gremlin is the de facto standard for communicating with graph databases that support TinkerPop, a graph computing framework from Apache, which includes databases like JanusGraph, Amazon Neptune, DSEGraph, OrientDB, and even Neo4J.
Gremlin is expressive, can be implemented fairly easily with some basic functions, and has language variants for most popular programming languages. The Gremlin query is the common language across most of the property graphs out there.
Nowadays, thanks to distributed storage systems like Cassandra, HBase, and Hadoop, you can effectively store an infinite amount of data in graph databases like JanusGraph or Neptune (provided by AWS).
What does JUGRI do?
While some databases have built-in browsers for quick data exploration, like the Neo4J Browser or the OrientDB Studio, there is no such tool for the Gremlin interface yet. Hence we created JUGRI to fill this void.
With JUGRI you can load the Gremlin results in Jupyter to visualize in a tabular way as shown in the examples below. It is inspired by ipython-gremlin, but we wanted to keep the interface Python native so that the code can be used outside the notebook too.
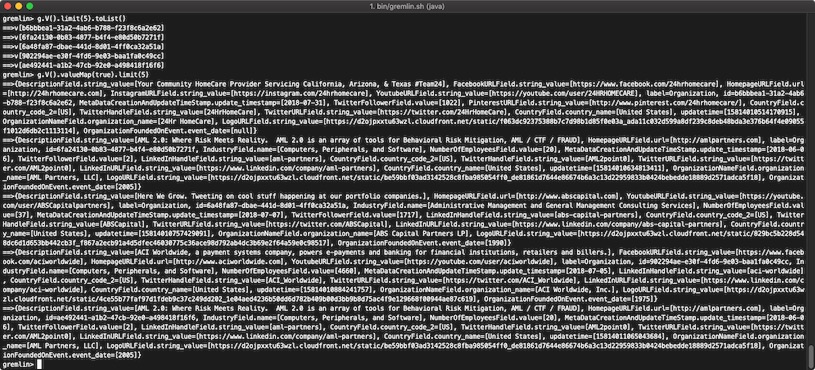
While in the Gremlin console you would need to transform a Groovy output like the following into something else:
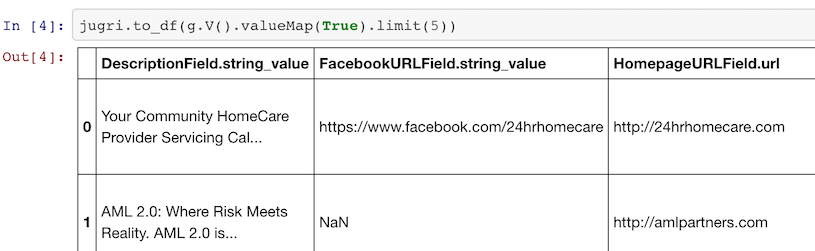
With JUGRI you can quickly explore your nodes like this:
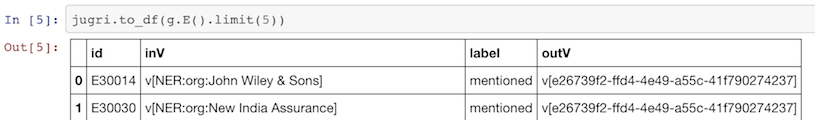
It can also show your connections:
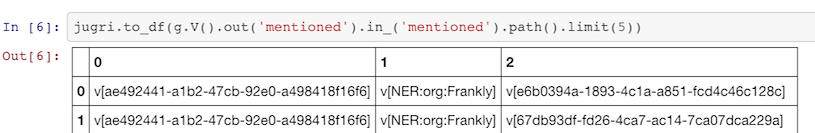
It shows each step of a path in a numbered column like this:
Of course you can provide a complex traversal with projections and it will show an expanded list of objects:
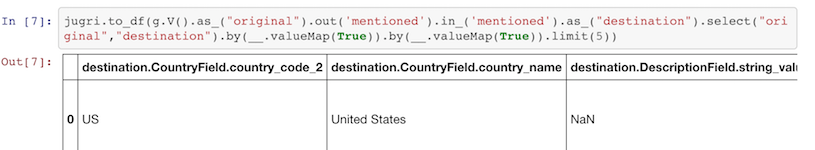
More examples can be found in the README or in the sample notebook.
At Meltwater’s Fairhair.ai division we use JUGRI to test new traversals against our main Knowledge Graph where we store information about entities and the events and signals around them. The tool helps us do quick explorations and deep dives into the data. The results can be viewed much more easily than in the Gremlin console and additional filters can be applied on top of the created Pandas Data Frames.
As an improvement for JUGRI, we are considering to add graph visualization using the networkX library, but of course we are also looking for suggestions to understand how others would use this package.
If you have a feature request don’t hesitate to open an issue on the projects GitHub page. We hope you’ll find this lightweight package as useful as we do!