
Since July 2019 I have been an intern at Meltwater in Budapest, working in the Foundation team that is focused on developer productivity. It has been a truly valuable experience to solve challenging real-life problems, that have an impact on the everyday lives of our developers.
In this blogpost, I will share my experience as an intern at Meltwater, and discuss the details of the project that I have been working on.
Logging and monitoring has become an essential part of developing software. No matter how good the engineers are, things do break eventually with unexpected bugs appearing, servers going down and applications crashing. When such things happen, logs are an extremely good starting point for locating, identifying and fixing the problem.
At Meltwater we utilise the ELK Stack for such purposes. In case you are not familiar with how Elasticsearch works on a basic level, do not worry. For the purposes of this post, all you need to know is that an Elasticsearch cluster is a group of nodes (servers), where data is stored in search indices, which are split up into multiple shards. These shards are distributed over the nodes for load sharing purposes. If you want to know more, take a look at the Basic Concepts of Elasticsearch.
Problem Statement
In May 2019 our team received 60 alerts concerning the indexing of live data falling behind. This is a lot. These alerts are caused by hotspots in Elasticsearch most of the time, meaning one or multiple nodes are bombarded with an incoming data rate that they cannot cope with. The phenomenon is worsened by traffic anomalies, where an application sends us an amount of data that we are not prepared for. In cases like this, some shards will overload node(s) no matter how hard we try to estimate incoming load. These scenarios increase the consumer lag significantly, consequently delaying the logs of all systems.
One major incident is worth mentioning, where our on-call engineer gave his blood, sweat and tears for 3 days to stabilise the logging system. We started ingesting an enormous amount of logs compared to what pipeline and cluster were able to handle, thus we experienced a significant lag in processing the incoming data.
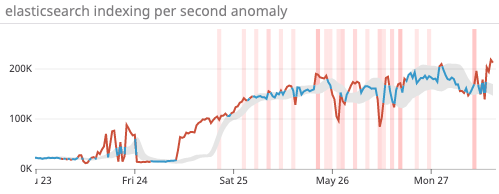
Figure 1: Increase in indexing performance during the major incident
The problem was mitigated by significantly scaling up the number of nodes in the cluster and the top four most affected indices to use more shards to handle the ingestion. This solved the immediate issue but was neither a cost efficient nor sustainable strategy. We can do better!
Exploring the Problem
Increasing computing power is trivially helping the situation, however it is worth taking a deeper dive into increasing the number of shards in load-heavy indices. Elasticsearch uses a built-in algorithm for the distribution of shards across nodes, taking two factors into consideration:
Every node should contain a close to equal number of shards.
Maintain efficient disk usage, by using the high and low disk watermarks. A node reaching low watermark is not allowed to receive more shards, while a node reaching high watermark is going to have some of its shards moved away.
This makes it obvious how increasing the number of shards for certain indices improve the overall load distribution of the logging cluster and also how it could eliminate hotspots. However, this built-in algorithm is truly ineffective for our use-case, because it makes the wrong assumption that every shard in the cluster is receiving roughly the same amount of workload.
To verify how far we are away from having an optimal distribution, we queried information about the cluster from Elasticsearch and visualised the following metrics, that seem to support our claims.
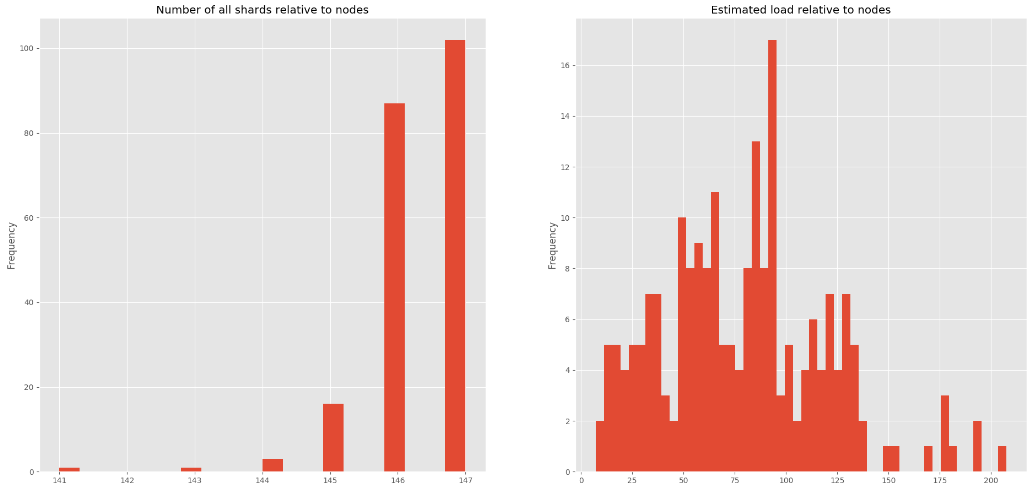
Figure 2: (left) The total number of shards located on the nodes vary between 141 and 147. Figure 3: (right) Our estimated load metric across nodes in the cluster. It is clear that some nodes are doing zero work, while others are overloaded.
Designing a more Efficient Algorithm
It is very clear that taking the number of shards is not a good estimation for workload. First, we need a metric that reflects the state of the cluster more precisely, then we can think about creating a more optimal distribution.
Deriving Load Metrics
The indexer is receiving documents from a wide variety of applications. For all these services, time-series data of the number of processed documents are queried from Prometheus with a timeframe of 2 weeks. In order to make our load prediction more accurate, we apply exponential smoothing to take recent events with a higher weight. Having calculated the load for every application, the only thing left is to divide this number with the corresponding number of shards. This way we introduced a shard-level metric for approximating load in the system.
Distributing the Load
Now that we have a more precise metric that we can optimise by, we have to think about distribution. Instinctively there is some resemblance to the famous bin packing problem, where we have to fit N number of weights in B bins with capacity C. Translated to our problem, the weights are the estimated loads of our shards, the bins are the nodes with a certain theoretical capacity to process logs.
Unfortunately bin packing is an NP-Complete problem and only approximating solutions exist in polynomial time. Letting the nodes become totally loaded up to their theoretical capacity is also not very wise, because if our load approximations are slightly inaccurate, hotspots will appear sooner or later. In light of this, we should aim to approximate an equal distribution for which the following algorithm is proposed.
- Determine desired optimal load level of a node. Taking the average is a plausible choice.
- Sort all nodes according to the total load on them.
- Take node N with the highest total load. We will move a shard from this node.
Search the shards on node N and select shard S such that by removing S, N gets as close to the optimal level as possible. Formally: \[S_{\text{SELECTED}} = min({|L}_{N} - L_{S_{i}} - OPT|)\]
where
\(L_{N}\) : Total load on node N
\(L_{S_{i}}\) : Load created by the i-th shard on node N
\(\text{OPT}\) : Desired optimal load level
Starting from the node with the lowest total load, we try to select a target node M such that the following constraints are satisfied:
a. Node M must not be located in the same availability zone as the node accommodating a replica of S.
b. If we moved shard S to node M, a predefined amount of free disk space must remain on M.
c. The total distance of N and M from the optimum must not increase after moving shard S
Return an optimal step, consisting of a shard, a source node and a target node.
- Perform the move on the simulation, return to step 2 and calculate the next optimal move according to the new state of the cluster.

Figure 3: Visualising the algorithm step by step
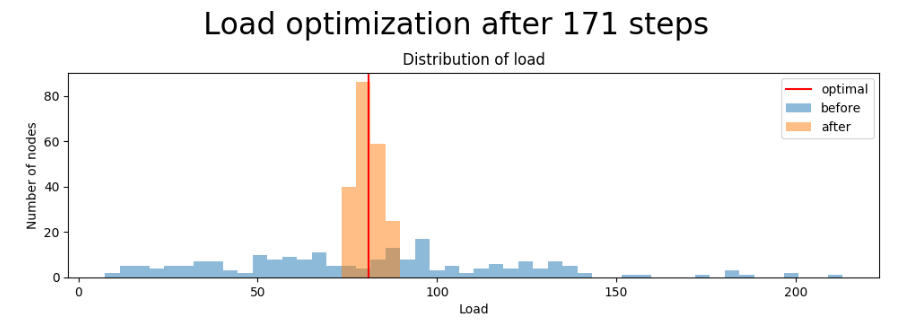
Figure 4: The distribution of load across nodes in the cluster before and after running the optimisation
Evaluating Cluster State
To be able to verify whether a given step is improving the overall situation, we experimented with different error metrics. A fairly simple metric turned out to be sufficient for our cause, Mean Squared Error. It is given by the formula \[MSE = \frac{1}{n} \sum_{i=1}^{n} (L_{i} - \widehat{L})^{2}\]
where
\(n\) : number of nodes in the cluster
\(L_{i}\) : Total load on the i-th node
\(\widehat{L}\) : Average load in the cluster for all nodes (desired load level)

Figure 5: The progression of MSE over 171 steps of optimisation

Figure 6: The complete optimization process from querying the data to evaluating the results.
Testing/Results
It is clear by now, that the algorithm is capable of optimising the load along one metric, but how this would improve cluster state is still an open question. In order to verify that the optimiser is actually making valid moves, we provisioned a testing environment to do stress-testing. To reproduce a situation similar to the incident detailed above, we unleashed a load that is way too much to handle for a cluster of this size. The results were promising. The distribution of workload became way more efficient, hence we have seen a significant increase in indexing performance.
Having verified that the algorithm is working correctly, we deployed the tool into production as a scheduled task running every hour.
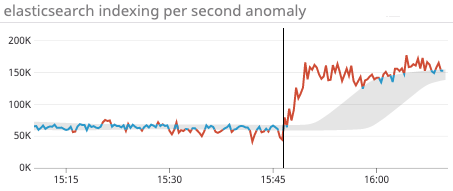
Figure 7: We have seen a three-times increase in indexing performance after executing all the suggested shard moves during the performance test
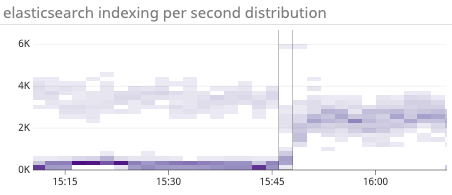
Figure 8: Before running the algorithm, many nodes were not doing any work. The state after optimisation shows a more even distribution, resulting in better indexing performance.
Future Improvements & Acknowledgements
We have discussed how sorting out load values is a pretty hard problem and exact solutions will not likely be calculated. But it looks like this approach is absolutely sufficient and the efficiency of the proposed method boils down to approximating the amount of load that logging applications will have in the future. This is where the application could be further improved, by introducing a more robust prediction for load values.
I would like to thank the entire Foundation team and especially my mentor for being passionate about the project, letting me experiment with my own ideas, but also being supportive and guiding me to figure things out on my own. I learned a myriad of things from new technologies to soft-skills like what it takes to effectively work as a team. As a matter of fact, I enjoyed my internship at Meltwater in Budapest so much, that we came to an agreement to extend it by another 3 months. So who knows, you might be seeing other blog posts from me here in the future.