 learning how to do load balancing")
Meltwater recently launched the Fairhair.ai data science platform. Part of this platform are several large Elasticsearch clusters, which serve insights over billions of social media posts and editorial articles. The nature of the searches that our customers need to run against this data quickly make the default load balancing behaviour of Elasticsearch insufficient.
In this post we explain how we built a custom search router using machine learning, that helps us to address the shortcomings of Elasticsearch’s default round-robin approach, and greatly improves search performance and fault tolerance.
Background
Fairhair.ai’s information retrieval systems contains around 40 billion social media posts and editorial articles, and handles millions of queries daily. This platform provides our customers with search results, graphs, analytics, dataset exports and high level insights.
These massive datasets are hosted on several Elasticsearch clusters totaling 750 nodes and comprising thousands of indices and over 50,000 shards. For more info on our cluster architecture please have a look at our previous blog post Running a 400+ Node Elasticsearch Cluster.
Our incoming search and analytics queries vary greatly in resource consumption and access patterns, which presents some very interesting challenges.
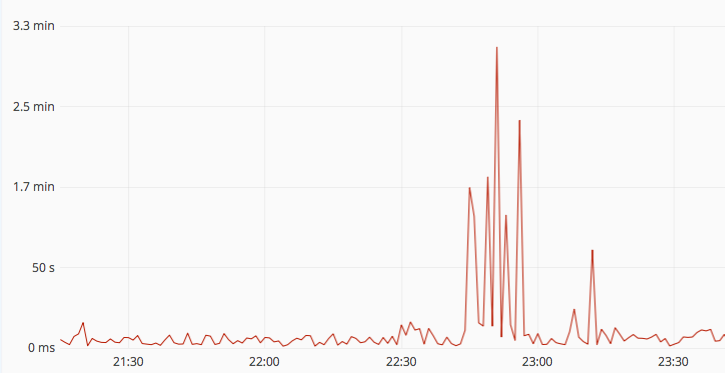
Figure 1: Spikes in response times: A few slow and complicated queries can negatively impact the performance of many other queries due to queuing and resource contention.
We broadly categorize incoming queries along these dimensions:
- Some queries are interactive and a human is actively waiting on the result, for example web apps would typically have this query pattern. Others are non-interactive, like large batch jobs and asynchronous report generation.
- Most queries complete in tens of milliseconds, and some other queries are very compute and data intensive and takes seconds or minutes to execute.
- Many queries hit a select few Elasticsearch shards, consume little resources and respond quickly. Yet other queries may hit thousands of shards and consume a lot of cluster resources, even though their overall response time is still on the order of tens of milliseconds.
Left unchecked, resource and time consuming queries will saturate machine resources and inflate wait times. If a simple 25 millisecond query gets a total response time of 5 seconds because of contention with other queries, that creates a very bad quality of service for our customers.
Segregating Queries
Each of our Elasticsearch clusters runs across 3 availability zones on AWS. To ensure redundancy and fault tolerance, each zone contains at least one replica of every shard. Hotter shards that receive a lot of queries will however have many more replicas to keep up with their workload.
Our setup with at least 3-way data replication means that any query can run fully contained within any zone. This gives us the possibility of dynamically segregating different categories of queries and drastically improving the quality of service; which is what we did by introducing an intelligent search router. Its goal is to route lower priority and expensive requests towards one particular zone, thus isolating resource hogging queries into a separate machine pool and preventing them from disrupting other queries.
This mechanism works hand in hand with the Elasticsearch Adaptive Replica Selection mechanism, but at a higher level. Together they ensure the smooth execution and fair quality of service for all categories of queries.
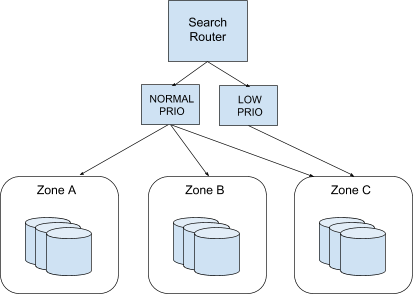
Figure 2: Segregating queries: Low priority queries (non-interactive or expensive ones) are routed to a single zone, which means that two zones will not be impacted by these requests. Normal priority requests usually execute on any zone, but adaptive load balancing (explained below) quickly steers them away from overloaded zones in times of heavy resource usage or system failure.
Adaptive Load Balancing
Intelligent routing decisions significantly improves the quality of service during normal operations, but unforeseen problems can still occur. Heavy queries slipping through or system failures in a zone could still cause problems. And at our scale the mean time between hardware failure is just a few days, though fortunately AWS EC2 and the cluster will automatically heal within minutes.
Our search router uses adaptive load balancing to mitigate these expected issues. If there are problems in one zone the algorithm will start routing requests towards the other zones instead, and under extreme pressure it may drop lower priority workload. Among other things it uses request counts, workload statistics, failure rates and a tournament algorithm to determine how to route queries.
This provides an additional layer of protection that ensures we can deliver a high quality of service during failures, and that the system degrades gracefully in the event of large scale problems.
Routing Algorithms
To start with, we use some simple heuristics to decide where to route a query. Known non-interactive queries can be routed to the lower priority zone; since there is no user waiting for the result it doesn’t matter too much if they take some extra time to complete. For example we route known batch applications based on the meta data they send, the size of the HTTP requests as well as the number of shards queried.
Heuristics are useful, but not enough on its own. There are many queries that are resource intensive due to their complicated Boolean filters, aggregations, parameters and a myriad of other features. If we can predict the resource usage of these queries, it makes it possible to also route the heaviest queries to the lower priority zone. To enable this dynamic routing we train a machine learning model to make resource usage predictions for incoming queries.
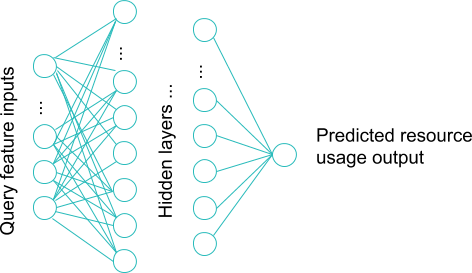
Figure 3: Deep learning: Utilizing the Keras framework on top of TensorFlow, we train a deep learning model that can predict resource usage based on the features and characteristics of the queries.
The Problem of Noise
Historical query logs contain an abundance of data and features which we can train our model on. However, the problem domain is complex and the data is noisy. We have thousands of queries running concurrently across hundreds of machines, and with many complex interactions it generates a lot of noise. To deal with this we collect measurements from our staging environment by running queries one at a time and create a clean dataset. From this dataset we train a model that can make real-time predictions, which the search router then uses in routing decisions.
We also have a working prototype of a ‘denoising’ model that can clean the noisy measurements, which would enable us to dynamically train a prediction model on the latest queries entering the system. This way our system would continuously learn from new queries and automatically adapt as the workload, infrastructure and cluster configuration continually changes. More information on this can be found in the talk Predicting Response Time in a Large-Scale Information Retrieval System that we gave at the GAIA conference.
Promising Results
The results are promising and in our simulation environment we can correctly identify approximately 77% of the heaviest queries. We are running a production version of this model, and continue to iterate on its architecture based on observations and feedback. While its more difficult to evaluate in production because of ‘noisy’ measurements to concurrent requests, we can see that the predictions correlate well with the actual resource usage. We have also witnessed concrete cases of the low priority zone being slowed down by heavy queries, while the other zones continue to respond quickly, which is just what we wanted to achieve. We also see that in general the response times for normal priority requests are much more stable, leading to an improved end-user experience compared to a vanilla Elasticsearch setup.
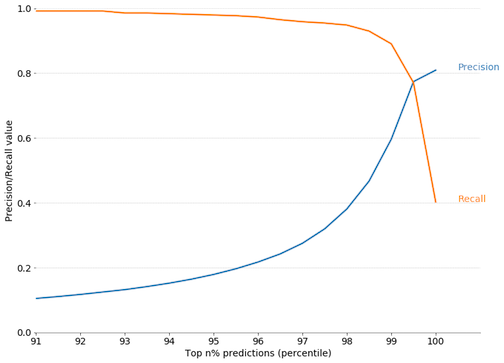
Figure 4: Predictive routing: Can we successfully predict the top 1% (heaviest resource consumption) queries? If we take the top 1% of predictions, recall = precision = 0.77. In other words, if we take the top 1% of predicted heaviest queries 77% of these were correctly identified as being ‘heavy’ queries. (numbers taken from our simulation environment).
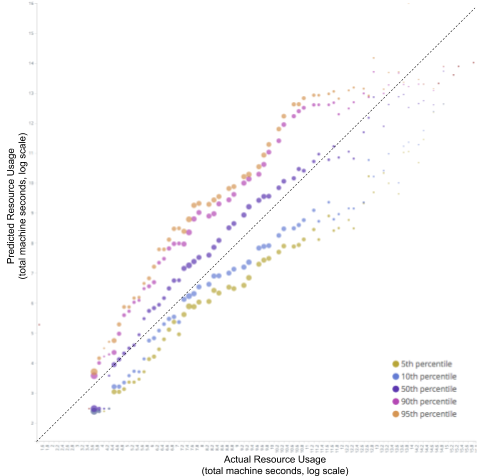
Figure 5: Predicted vs actual resource usage, production data: On average, predictions correlate well with actual resource usage, with less accuracy at the extreme percentiles. Note that the actual resource usage is a ‘noisy’ and not completely reliable measurement due to concurrent requests.
Conclusion
Today, we handle about 3 million queries per day with a median response time of just 130 ms and we have a service level of 99.997%. Our search router is a key component that enables us to efficiently support an information retrieval system at this scale. It is also critical in providing a service that gives a high quality end-user experience.
Our resource usage prediction model is an important part of the search router and is successfully operating in production. It is however still in its infancy and we are continuing to evaluate its accuracy, identifying cases where the predictions are inaccurate and adding new features and data to improve it.
All these improvements help us provide a fast, consistent and reliable search and analytics infrastructure for all of our users, even under expected and unexpected circumstances.
Thanks for reading! If you want to share your own experiences with custom search routers in Elasticsearch, or if you have questions about our approach, please leave a comment below.