We recently decided to open source our high-performance batch-percolator plugin for Elasticsearch. This article tells the story of how and why it was developed, and also gives you some insight into the scalability and performance problems we face daily in our engineering team.
Early 2014, we were in the midst of migrating our search backend to Elasticsearch. Although the new system was performing on par with our legacy system, we were still facing a wall of performance issues. Most importantly, we did not meet the top requirement for the system. We need to successfully execute at least 30 000 queries within 15 minutes to generate digest morning reports for our customers in one timezone.

Percolation in elasticsearch
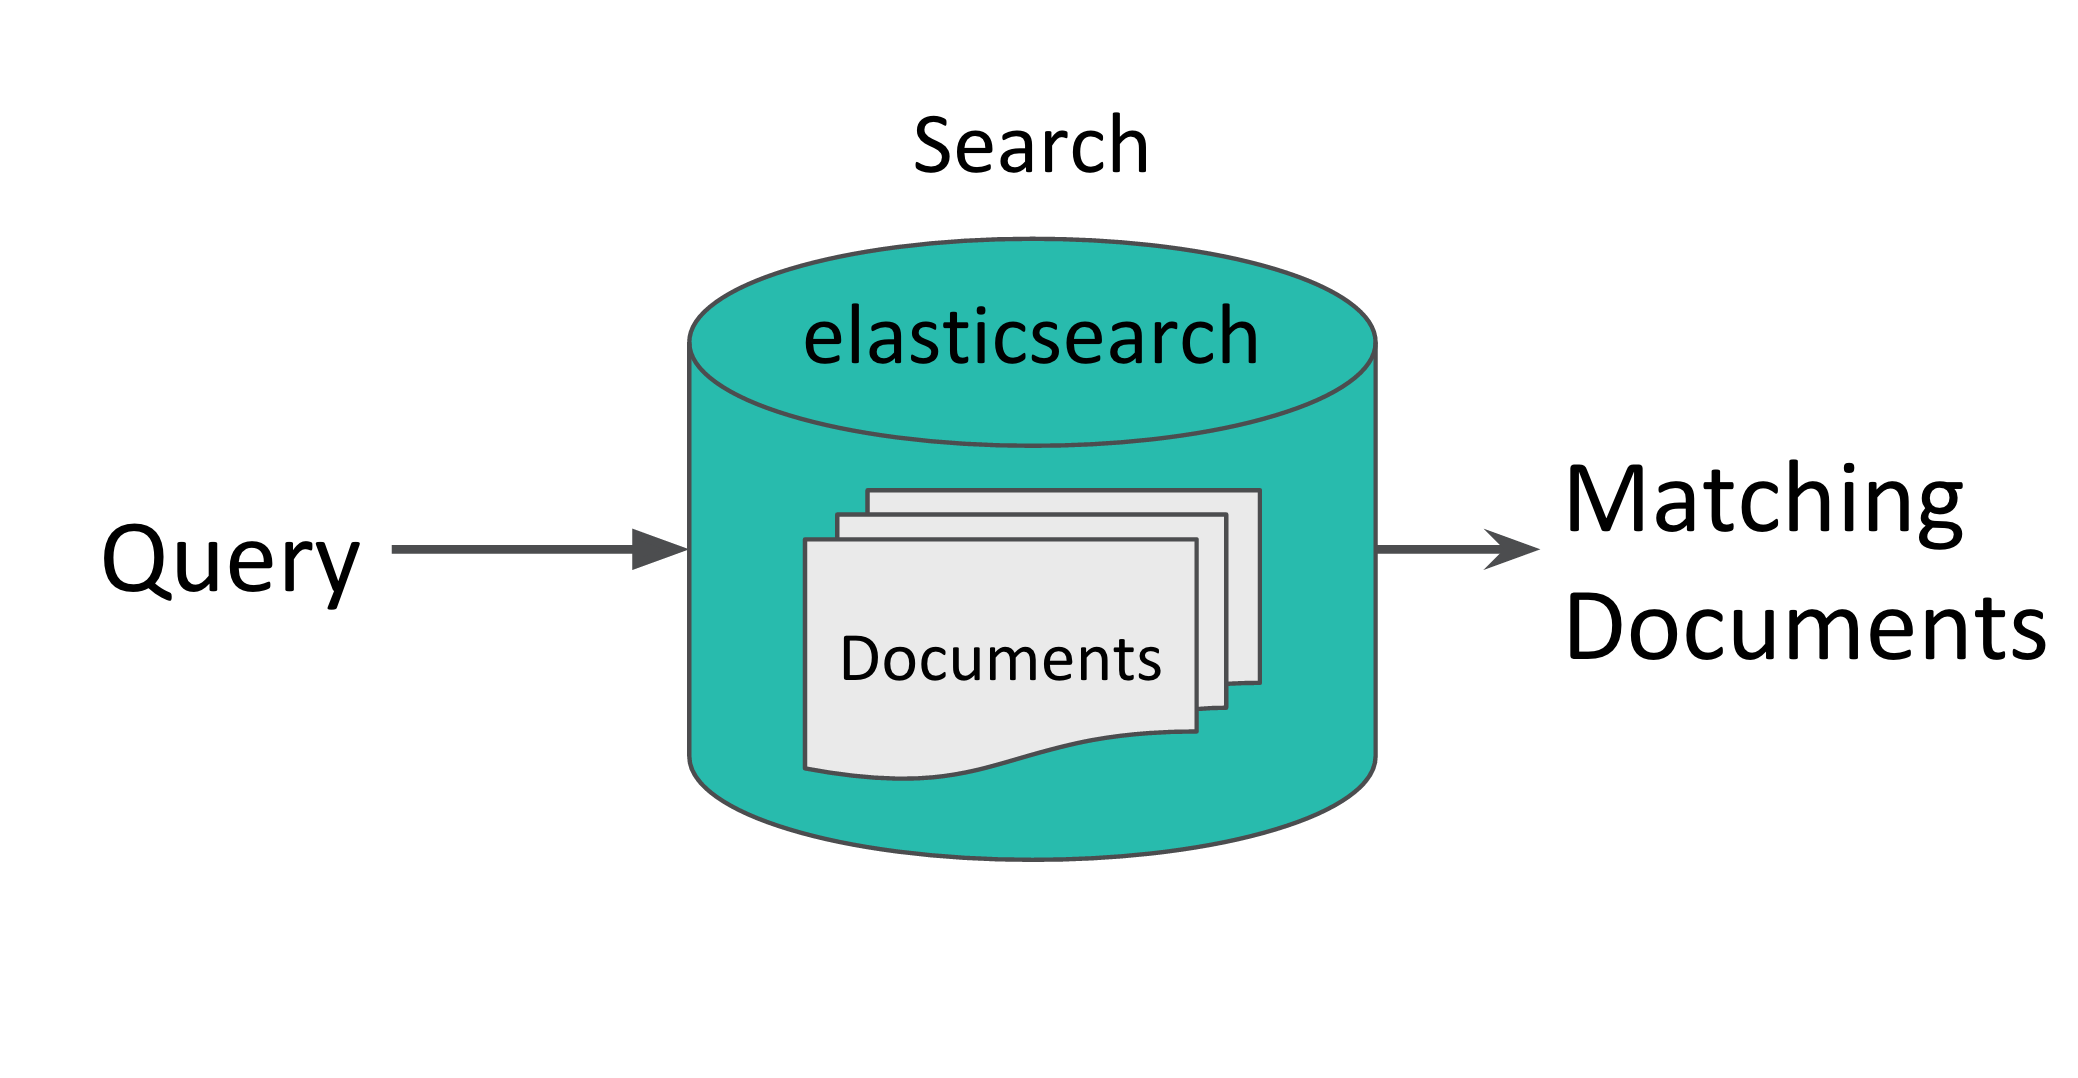
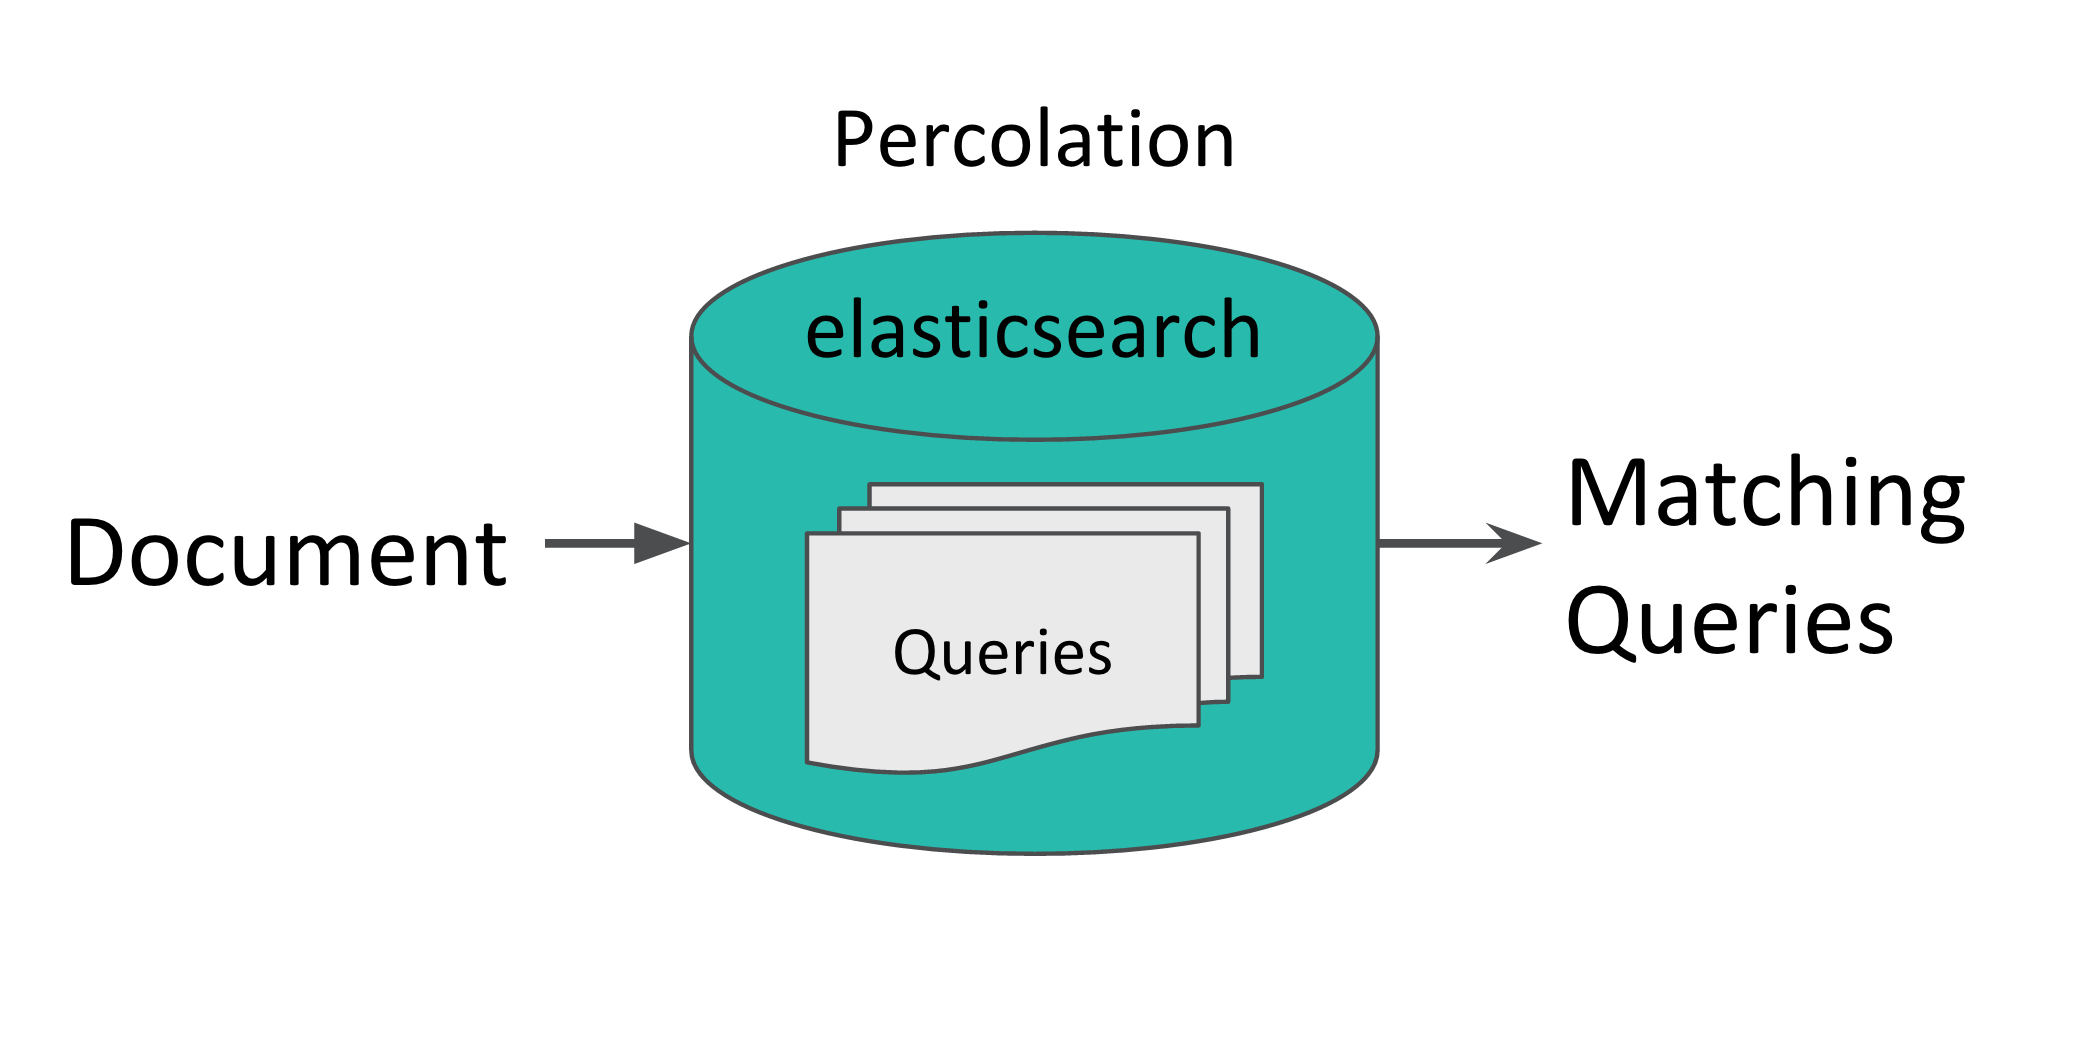
Fortunately, Elasticsearch has a built in module called the percolator which conceptually fits this problem perfectly. In normal search, documents are registered to an index and are then matched to incoming queries.  Percolator is basically search-in-reverse, as queries are stored in an index and documents are sent in to see which queries matches the documents.
  What this means is that the load can be spread out over time. Instead of having to execute all 30 000 searches in 15 minutes, the queries are executed on documents as they enter the system. By storing these results, we can get the full result set for a query over the last 24 hours immediately without having to execute a search on the fly.
Problem solved?
We did some local testing with quite disappointing results, but we decided to give it a try on our production hardware. At Meltwater we use bare metal machines. Our percolation cluster consists of six machines with 360 GB of RAM and 24 core Intel Xeon 2.4 GHZ processors which we assumed would be more than enough to meet the throughput requirements.
We started out by doing a test with hundred thousand of our real customer queries registered to the cluster.
| Registered queries | Number of documents sent in | Throughput (documents per second) |
|---|---|---|
| 100 000 | 20 000 | ~ 1 |
A back-of-the-envelope calculation based on these results showed that we would need a cluster of at least 24 of those monster machines just to keep up with our current load of editorial documents. Add to this that the volume of editorial documents is doubling every two years and that we also need to keep up with ~700 social documents (tweets/facebook posts) per second.
Why is the performance so bad?
Arguably the most challenging factor we have when it comes to performance is the backlog of nasty queries we’ve built up over the years. Our users are more interested in precision than recall, which means that normal boolean queries are not enough to get desired results. We’re relying heavily on wildcard queries and positional queries like Span, Phrase and MultiPhrase.
One simple example of such a nasty query is:
Obama NEAR (*co* OR pre* NOT Michelle)
This query is parsed into the following Lucene query:
SpanNear(
    SpanTerm(Obama),
    SpanMultiTermQueryWrapper(*co*),
    SpanMultiTermQueryWrapper(pre*),
    SpanNot(Michelle)
)
Before this query is executed on an index, it is first rewritten to the basic queries which Lucene actually knows how to execute. In this case, SpanNear, SpanTerm and SpanNot are all basic queries, but not SpanMultiTermWrapper.
The SpanMultiTermWrapper(pre*) is rewritten in the following way
- Convert to a
SpanOr(SpanTerm[])query. - Expand the wildcard ‘pre*’ by searching through the index terms-trie for all terms with prefix ‘pre’.
- For each of those terms, add the term to the
SpanTerm[]array in theSpanOrquery.
The same approach is taken for SpanMultiTermWrapper(\*c\*), except that the lookup of the terms itself is much slower, since Lucene does not know where to start looking in the terms trie.
After the rewrite phase is done, the query will look like something like this:
SpanNear(
    SpanTerm(Obama),
    SpanOr(SpanTerm('company'),SpanTerm('morocco'),SpanTerm...),
    SpanOr(SpanTerm('president'), SpanTerm('prerequisite'),SpanTerm...),
    SpanNot(Michelle)
)
As you might realize, the list of terms that the wildcards are expanded to might get extremely high for some wildcards. It’s not uncommon for us to see that a wildcard is rewritten into hundreds of thousands of terms. However, Lucene is an incredible piece of software and is still able to execute most of those wildcard queries in sub-second time. But for this specific query, Lucene 4.x falls short due to its inefficient execution of positional queries.
This is how you would think that the query is executed:
- Find all documents which have the term ‘Obama’
- Find all documents which does not have the term ‘Michelle’
- Find all documents which have any of the terms in the
SpanOrclauses - Do a conjunction between all the matched documents.
- Lookup the positions of all the matching terms in the documents which match all the clauses.
But what actually happens is that Lucene will lookup all the positions for all the matching terms in all documents in the index. So even if only 10 documents in total match all of the clauses, we can lookup the positions of the term ‘company’ in potentially hundreds of thousands of documents. Looking up positions of terms is a very expensive operations, so queries like these result in extremely low performance. In our case, it’s not unusual that these queries takes minutes to execute.
Let the experimentation begin
After the failed experiment with the elasticsearch percolator, we decided to make our own fork and perform some experiments. Elasticsearch has an excellent plugin system, which means that we can maintain our own fork of the percolator without having to maintain our own version of elasticsearch. (Actually, we do maintain our own fork of elasticsearch for other reasons, but we’ll talk about that in the next blog post)
#1: Batching of documents
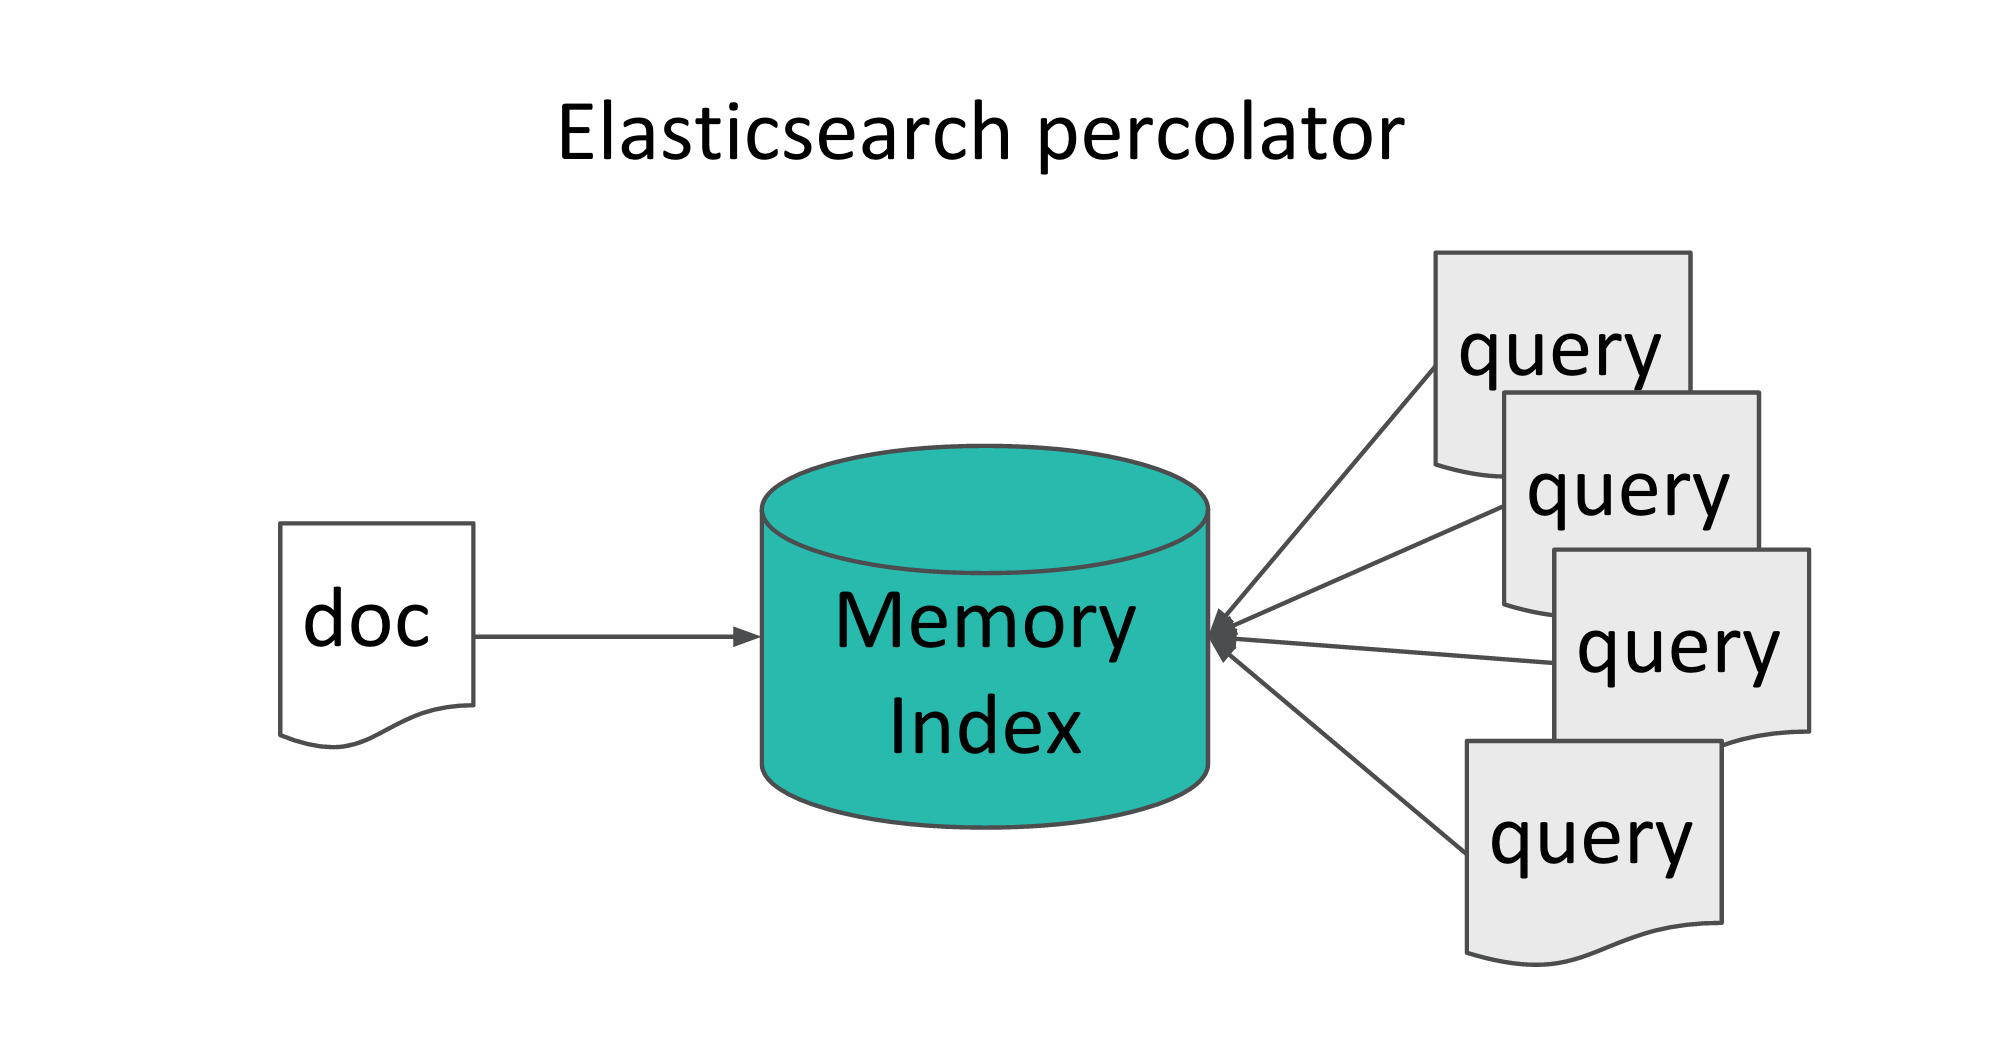
The elasticsearch percolator only operates on one document at a time. One of the reasons for this is that some of the features of the percolator (like query-aggregations, query-filtering) relies on this to work. Also it uses a highly optimized index type called the MemoryIndex which can only hold one document at a time.
Even though the MemoryIndex is faster than the slightly outdated RamDirectory for single documents, we wanted to test out how it could compare to a RamDirectory with a large batch of documents. A previous engineering team at Meltwater had successfully forked the old percolator (ES 0.18.x) and modified it to accept batches of documents. This worked well for the product (tweets and simple queries).
In elasticsearch 1.0 the multi-percolator was added which wraps multiple single-document percolation requests into one request. This makes the requests more efficient from a transport perspective, but it should not be confused with batching (operating on multiple documents at the same time). Based on the idea from the old batch percolator, we created the new batch percolator from the official elasticsearch percolator.


We ran the tests again with our new batchpercolator plugin. By using batches of 1024 documents, we got the following result:
| Registered queries | Number of documents | Document throughput |
|---|---|---|
| 100 000 | 20 000 | 8 DPS |
Even though we just increased our throughput by more than 800%, the prospect for meeting our requirements was still grim. At this stage, we went into a frantic period of experimentation.
#2: Luwak
There is a clear pattern for the queries in our backlog: the ‘nastier’ they are, the higher precision they have, meaning they will match less documents. Some of our nastiest queries will only match one or two documents per day. We realized that if we could find a way to filter out some queries before they are executed on a batch, we could get a big win.
We found a very cool project called Luwak which does exactly this. Explaining how Luwak works is a bit out of scope for this blog post, but we encourage you to take a look at their presentation which gives a lot of insights into percolation and Lucene. We quickly created a prototype plugin based on Luwak and did some measurements on our local machines:
| Number of queries | Query classification | Throughput (Documents per second) |
|---|---|---|
| 20 0000 | Simple (Term) | 75 |
| 100 000 | Simple (Term) | 70 |
| 20 0000 | Nasty | 8 |
| 100 0000 | Nasty | 1 |
The performance for simple term queries are amazing. The performance for ‘nasty’ queries is also good considering that these tests were performed on our local laptops, while the previous tests were all executed in our production cluster. Despite these results and the ‘elegance’ of the solution, this approach still had a lot of drawbacks. There was a lot of complexity in the code, and a lot of the nastiest queries could never be filtered out using Luwaks logic.
#3: Two-phase query execution
Based on the experience with Luwak we came up with a simplified approach that suits our use case and that works together with batches. As shown previously, the most expensive queries in Lucene are positional wildcard queries. But all positional queries are just a more precise version of boolean queries. A document which matches “Obama NEAR *co*” will always match “Obama AND *co*”. In other words, documents which match a query are a subset of documents matching a corresponding boolean query.

So from our previous example, the documents which match:
SpanNear(
    SpanTerm(Obama),
    SpanMultiTermQueryWrapper(*co*),
    SpanMultiTermQueryWrapper(pre*),
    SpanNot(Michelle)
)
Are a subset of documents matching:
AND(
    Term(Obama),
    Wildcard(*co*),
    Wildcard(pre*),
    Term(Michelle)
)
Which in turn are a subset of documents matching:
AND(
    Term(Obama),
    Not(Term(Michelle))
)
The last approximation still only matches less than 0.003% of all documents, which means that the original expensive query will be executed for only a fraction of all batches that comes in. We will call this approximated version of query a LimitingFilter from now on.
The algorithm we use in the batch-percolator is as follows:
- For all queries that are registered, create a
LimitingFilterversion of it. - When a batch of documents is sent in, index them into a temporary index.
- Execute all
LimitingFilterqueries on the index - For all
LimitingFilterqueries that matched any document, execute the original query.
With batching and the two-phase execution logic in place, we ran the tests again in our production environment:
| Registered queries | Number of documents | Throughput (documents per second) |
|---|---|---|
| 100 000 | 20 000 | > 300 |
These results were way better than we had expected. Finally, we had reached our goal and were ready to go live. Today we know that the batch percolator with our current production hardware can handle all of our customer queries with a peak load of well over 100 editorial documents and 2500 social documents per second.
Conclusion
We’ve combined batching and two-phase query execution into our ‘elasticsearch-batch-percolator’ plugin. After battle testing it for six months in production, we decided to make it available on github.com/meltwater/elasticsearch-batch-percolator.
We are very excited for the launch of Elasticsearch 2.0 which is based on Lucene 5.x which is way smarter when it comes to query execution. Positional queries will be two-phase out of the box, and term positions are only evaluated when all clauses match a document. Hopefully this will allow us to simplify our plugins by removing our two-phase execution step, but we will have to wait and see.
Lastly, we’re looking for talented engineers both in San Francisco and in Gothenburg, Sweden. If things like this interest you, send us an email.